
- Home >
- Stock Photos >
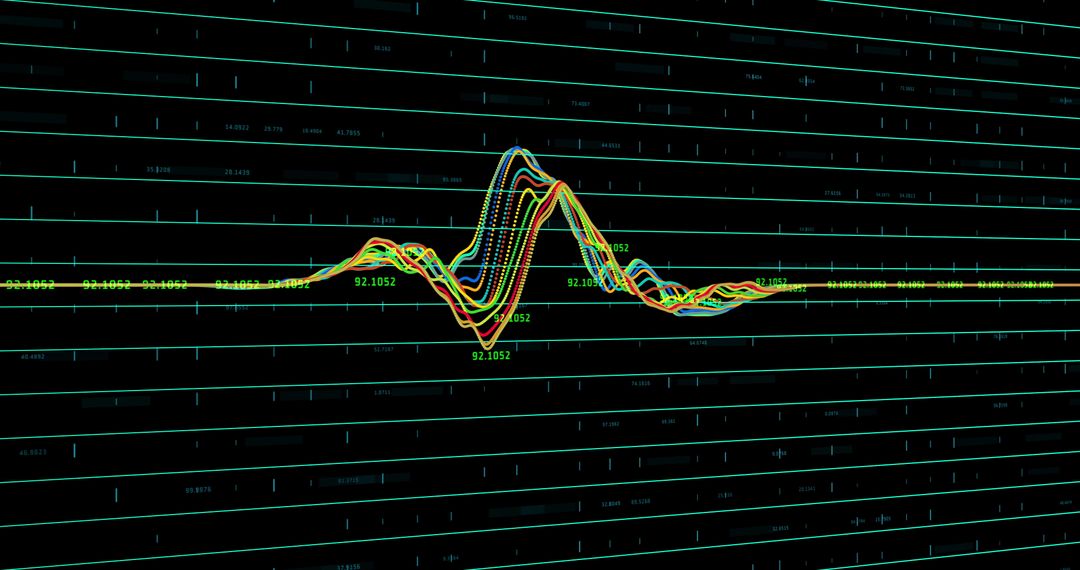
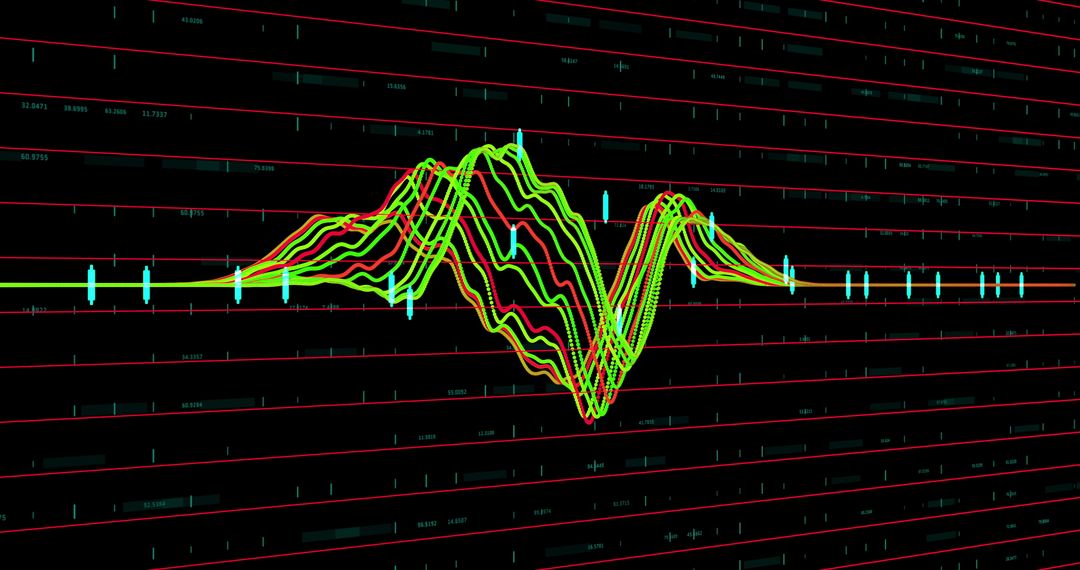
- Dynamic Green Stock Chart on Digital Grid Background
Dynamic Green Stock Chart on Digital Grid Background Image

Complex chart showcasing financial trends against dark grid backdrop. Useful for presentations about market analysis, business strategy, and investment opportunities.
Powered by 


3
downloads
downloads
Tags:
More
Credit Photo
If you would like to credit the Photo, here are some ways you can do so
Text Link
photo Link
<span class="text-link">
<span>
<a target="_blank" href=https://pikwizard.com/photo/dynamic-green-stock-chart-on-digital-grid-background/e33aa317ba27b7ff1b5c4820d77d3117/>PikWizard</a>
</span>
</span>
<span class="image-link">
<span
style="margin: 0 0 20px 0; display: inline-block; vertical-align: middle; width: 100%;"
>
<a
target="_blank"
href="https://pikwizard.com/photo/dynamic-green-stock-chart-on-digital-grid-background/e33aa317ba27b7ff1b5c4820d77d3117/"
style="text-decoration: none; font-size: 10px; margin: 0;"
>
<img src="https://pikwizard.com/pw/medium/e33aa317ba27b7ff1b5c4820d77d3117.jpg" style="margin: 0; width: 100%;" alt="" />
<p style="font-size: 12px; margin: 0;">PikWizard</p>
</a>
</span>
</span>
Free (free of charge)
Free for personal and commercial use.
Author: Authentic Images
Similar Free Stock Images
Premium


Premium


Premium


Premium


Premium


Premium


Premium


Premium


Premium


Premium


Premium


Premium


Premium


Premium


Premium


Premium


Premium


Premium


Premium


Premium


Premium


Premium


Premium


Premium

