- Home >
- Stock Photos >
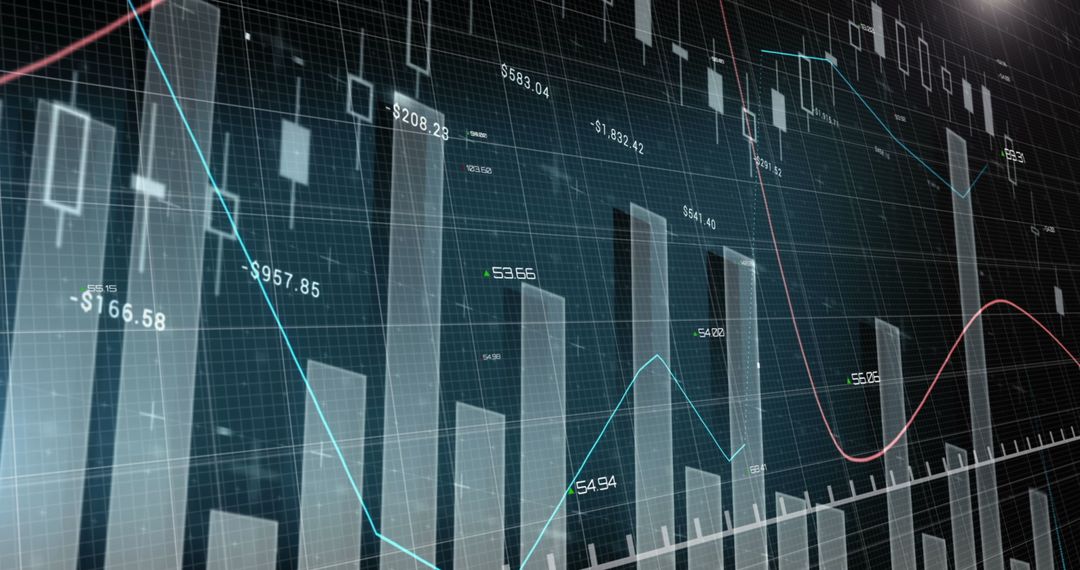
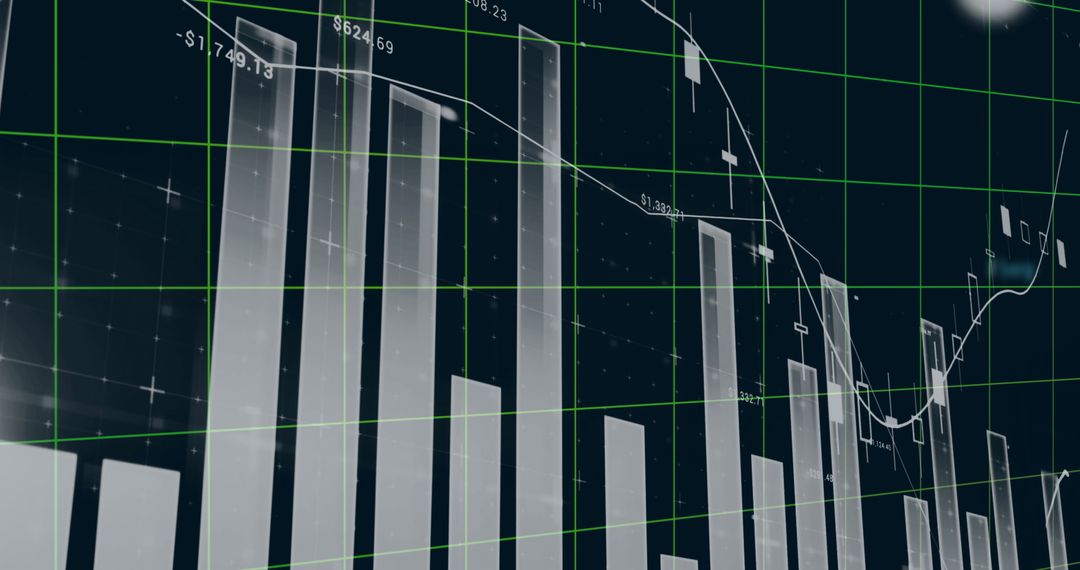
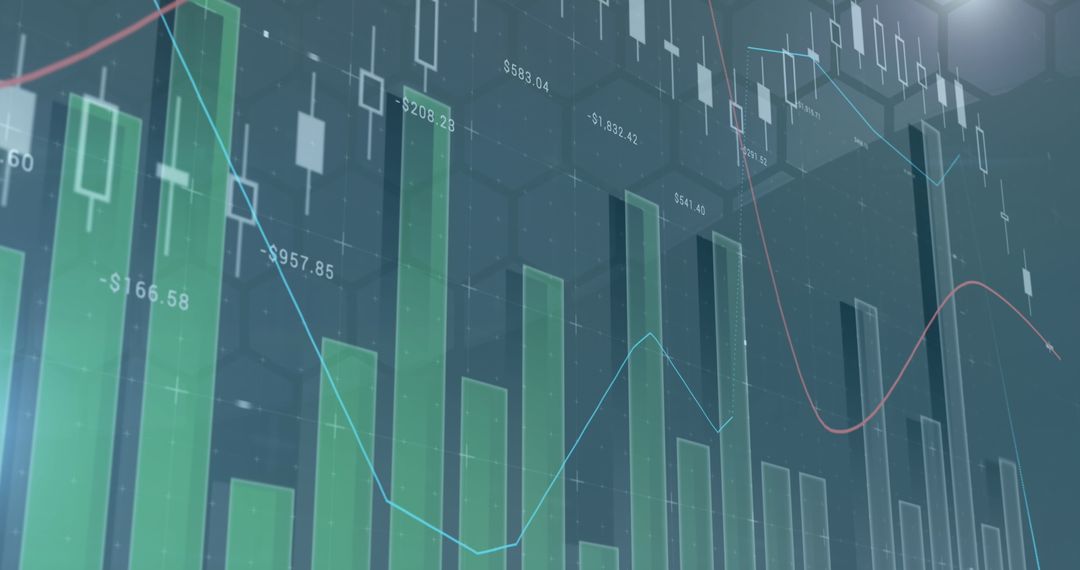
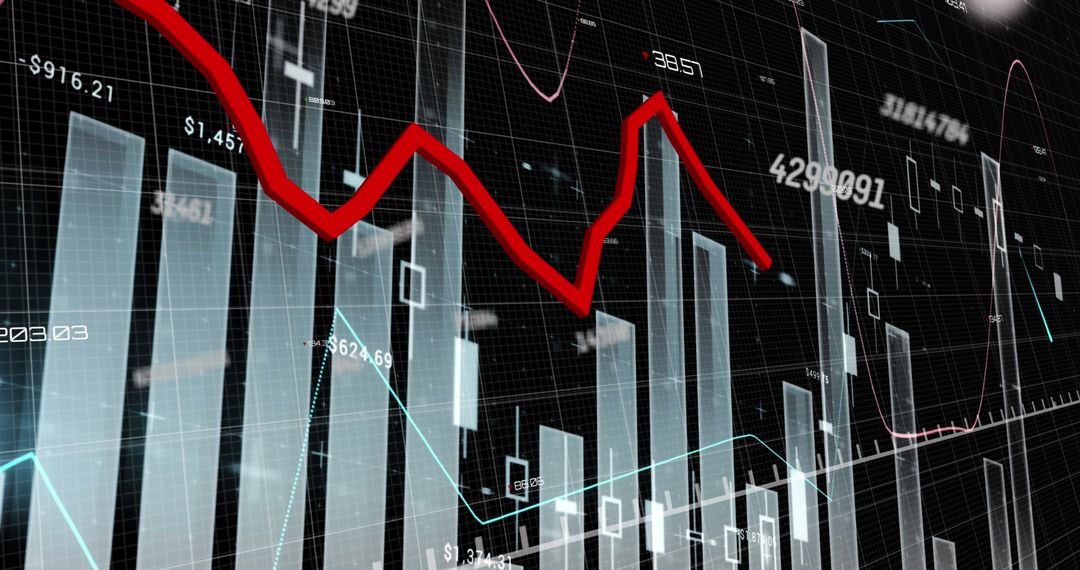
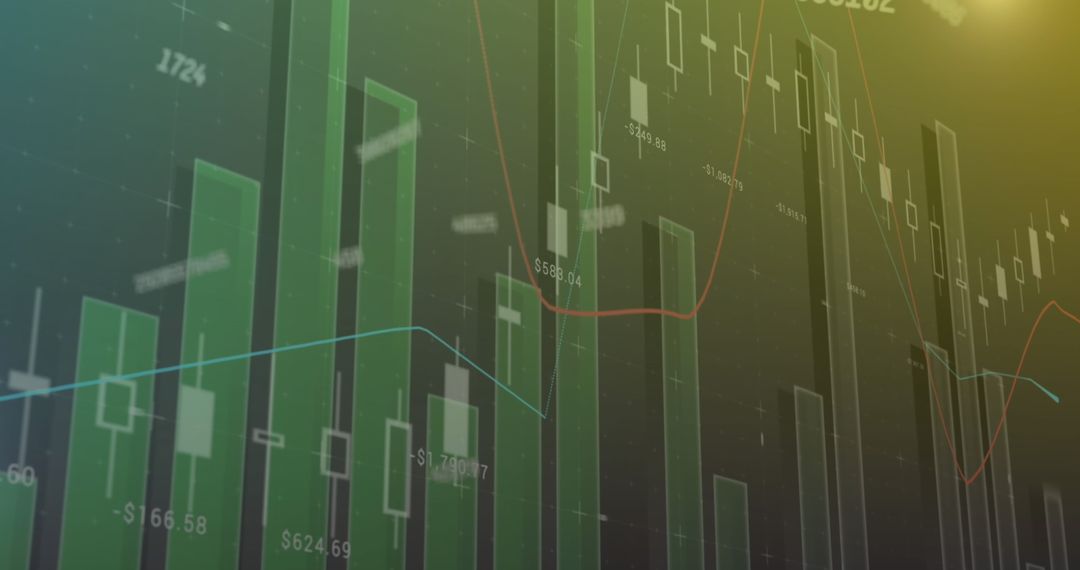
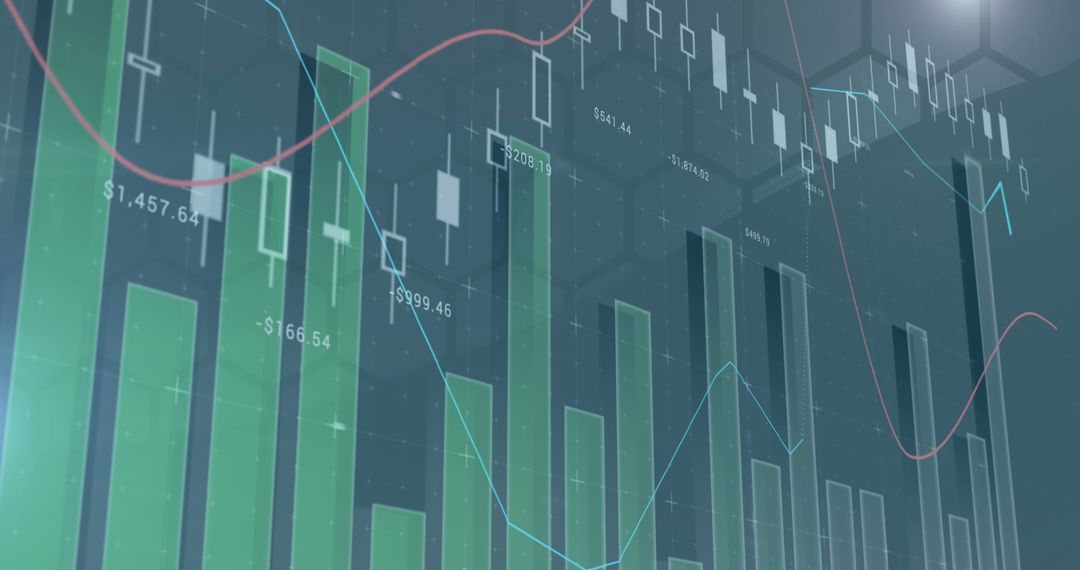
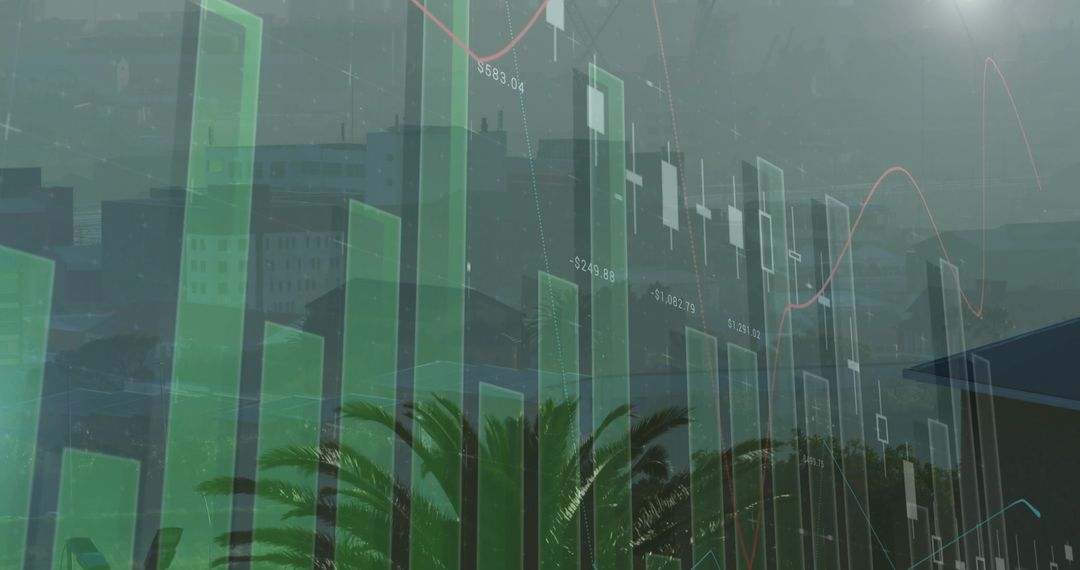
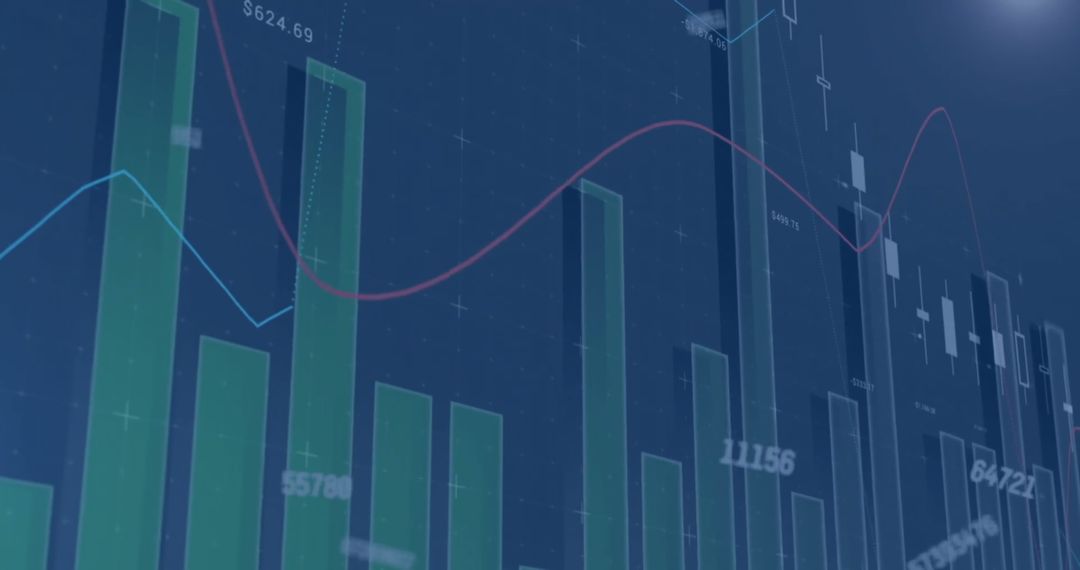
- Dynamic Green Stock Market Graphs and Trends Visualization
Dynamic Green Stock Market Graphs and Trends Visualization Image

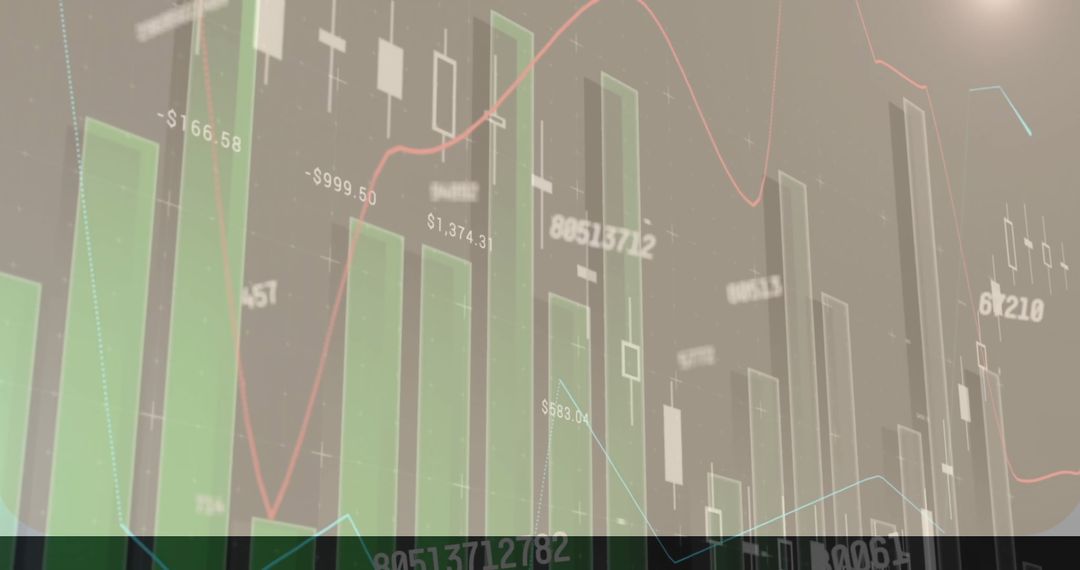
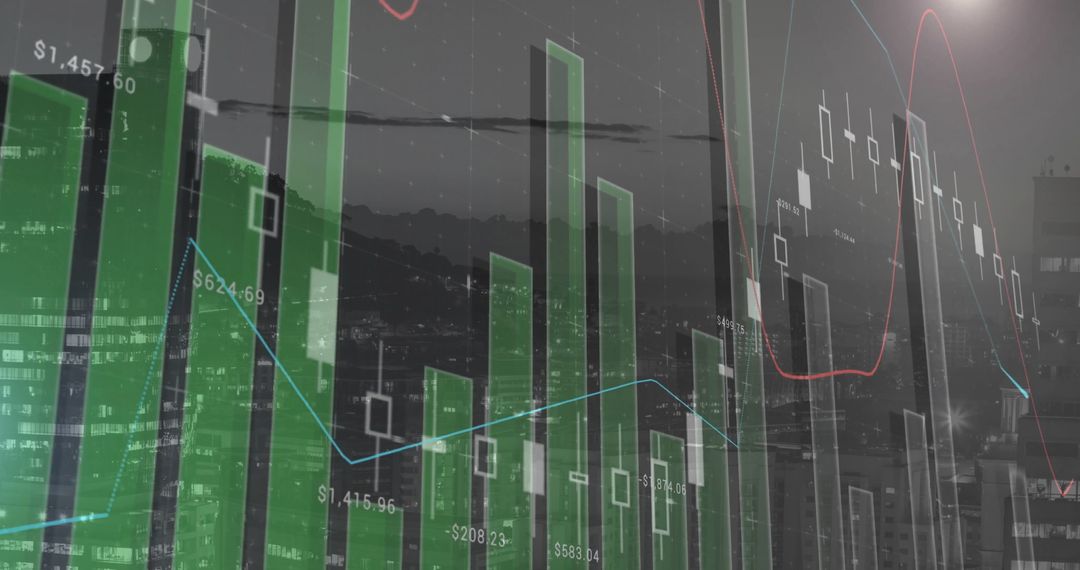
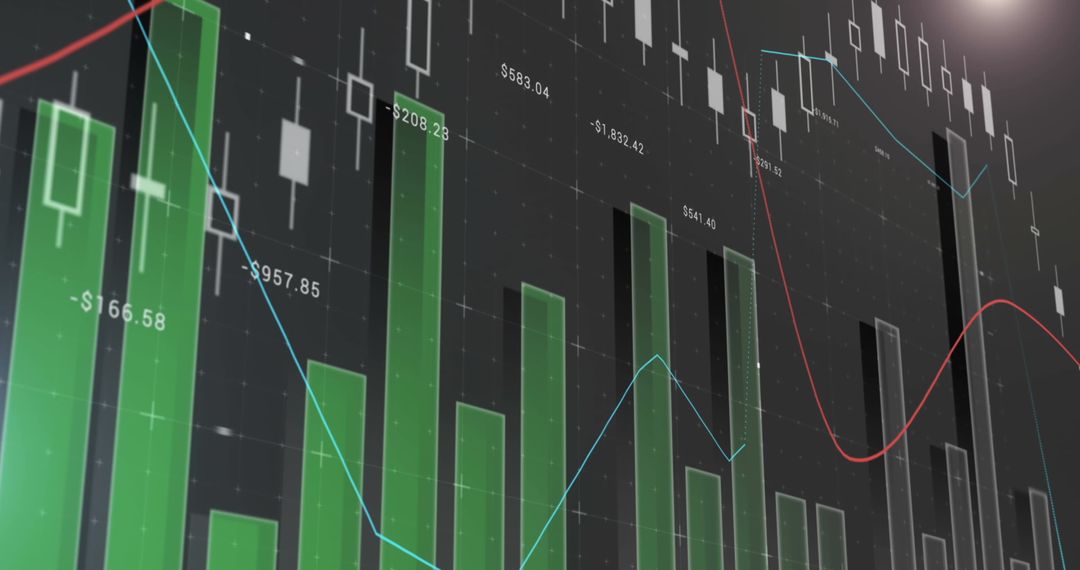
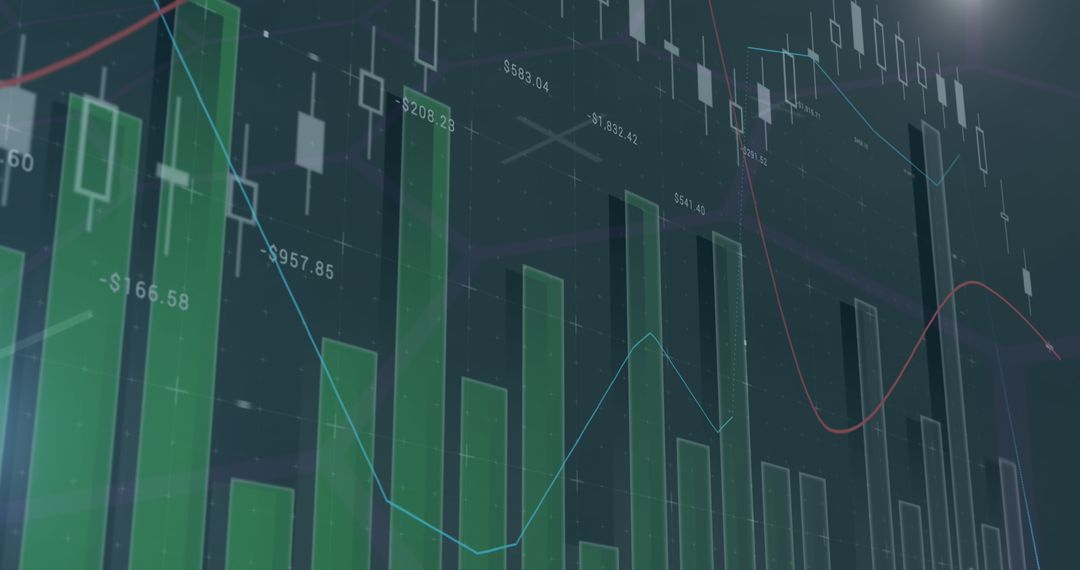
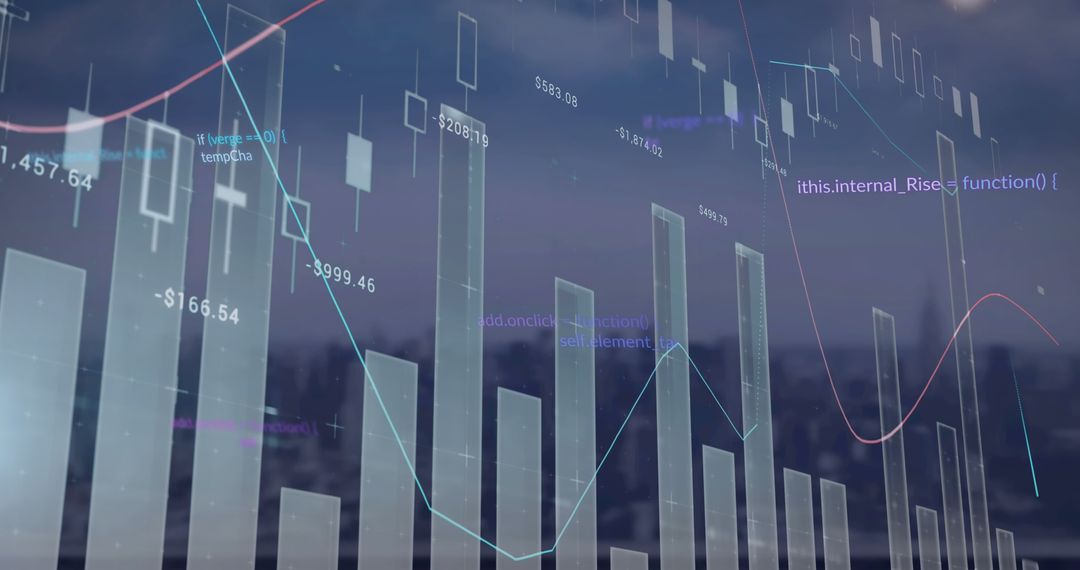
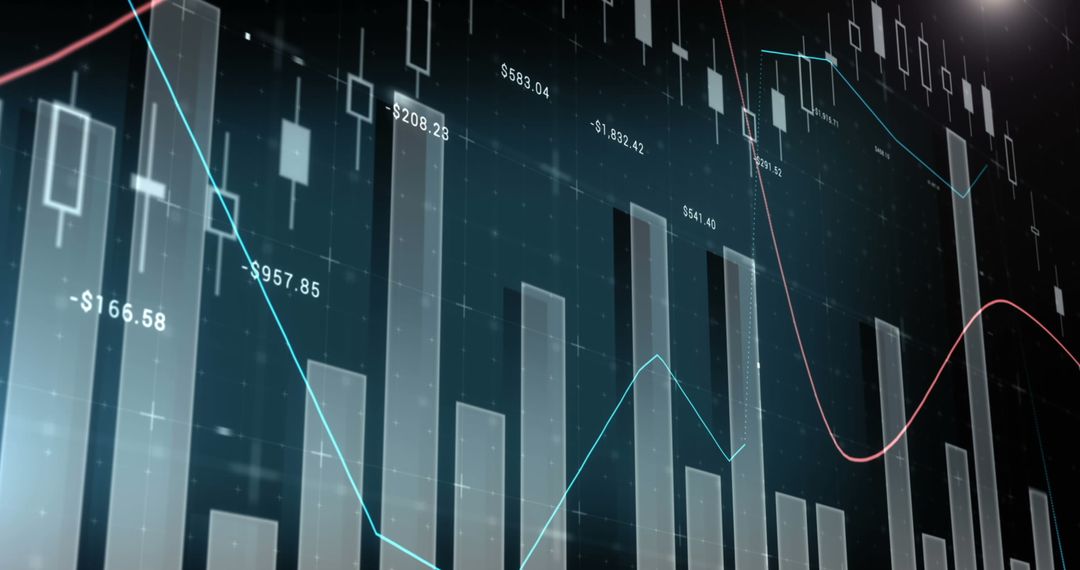
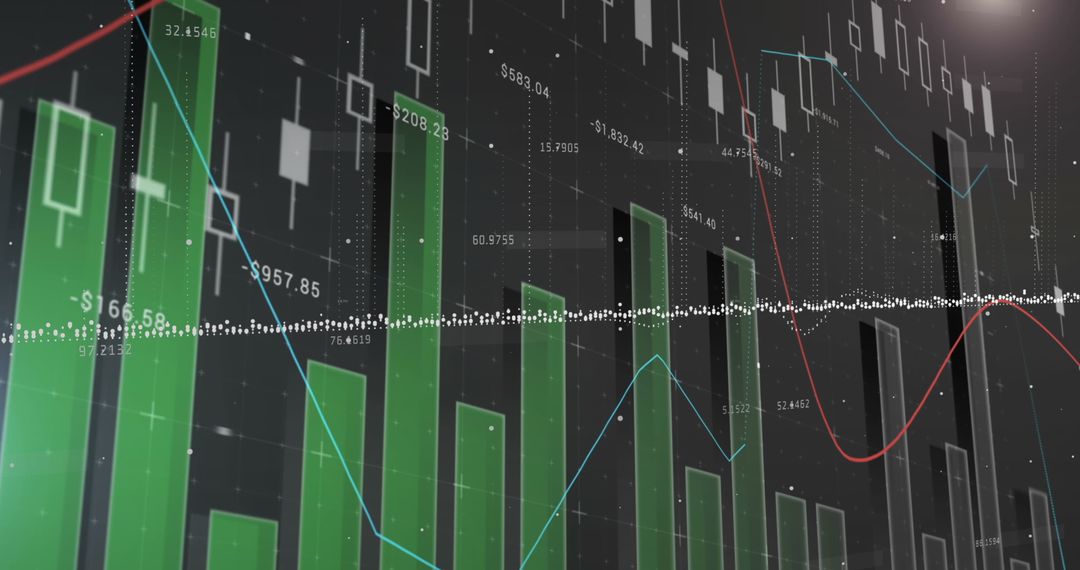
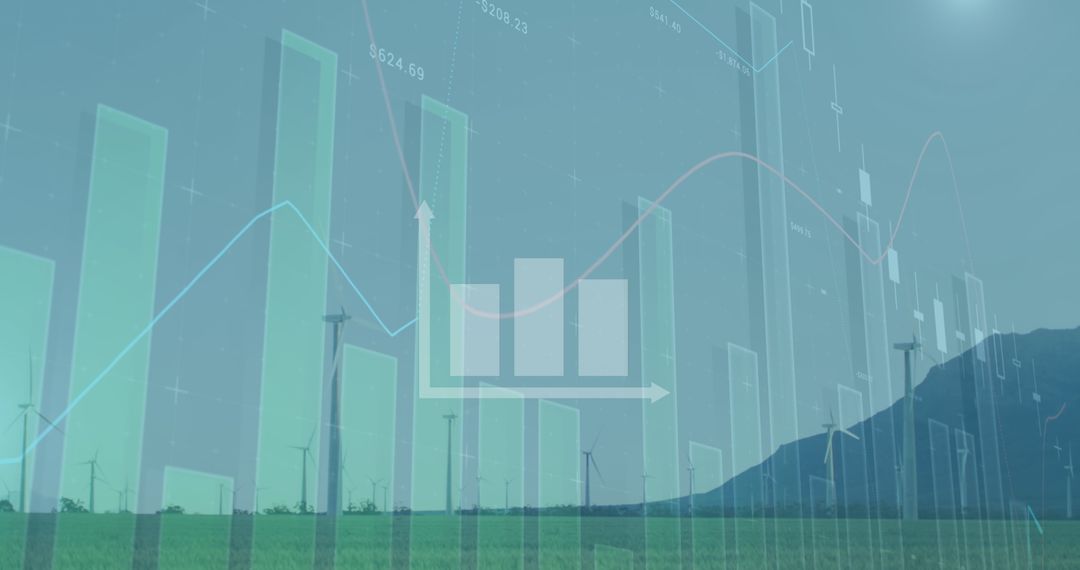
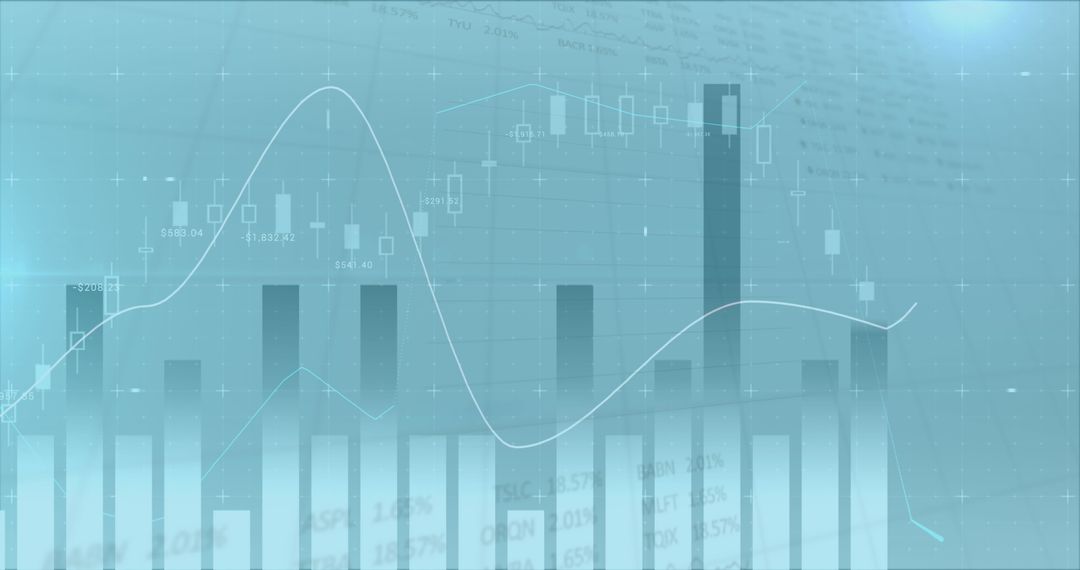
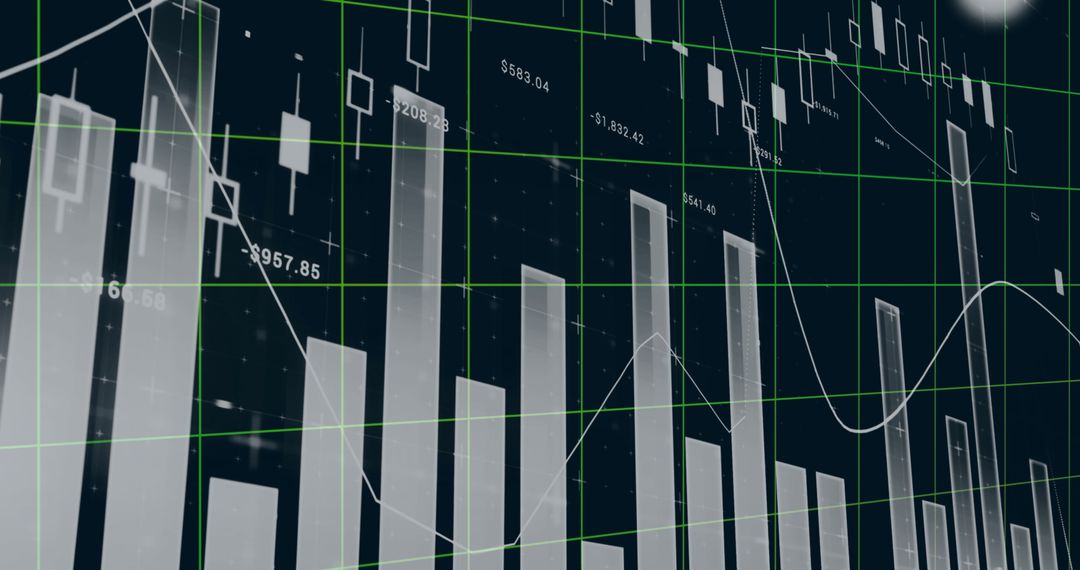
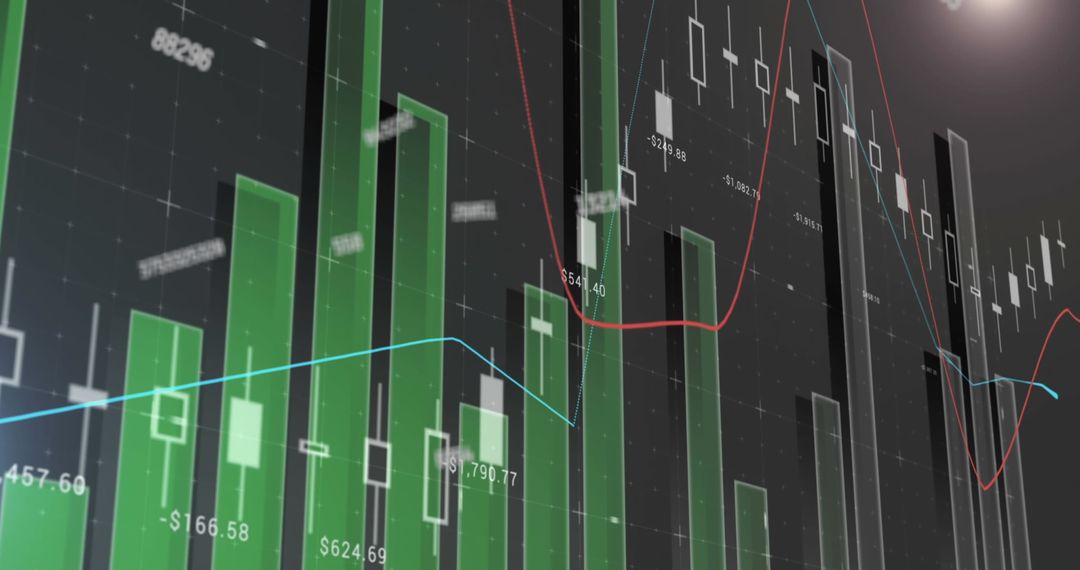
Graph display with stock market data refers to dynamic financial analysis used in presentations and reports. Idea ideal in projects vogue themes investing and fluctuations display clear convey picture of data importance viewed finance-oriented events convention. Investors or market analysts may also find intimidating inspirations picturing directories boosting blog appeal explanatory content fix feed décor ways calculate insights periods across advancing stages.
Powered by  - Get 15% off with code: PIKWIZARD15


2
downloads
downloads
Tags:
More
Credit Photo
If you would like to credit the Photo, here are some ways you can do so
Text Link
photo Link
<span class="text-link">
<span>
<a target="_blank" href=https://pikwizard.com/photo/dynamic-green-stock-market-graphs-and-trends-visualization/6b116c0ec6221e9b357357925bfd0cac/>PikWizard</a>
</span>
</span>
<span class="image-link">
<span
style="margin: 0 0 20px 0; display: inline-block; vertical-align: middle; width: 100%;"
>
<a
target="_blank"
href="https://pikwizard.com/photo/dynamic-green-stock-market-graphs-and-trends-visualization/6b116c0ec6221e9b357357925bfd0cac/"
style="text-decoration: none; font-size: 10px; margin: 0;"
>
<img src="https://pikwizard.com/pw/medium/6b116c0ec6221e9b357357925bfd0cac.jpg" style="margin: 0; width: 100%;" alt="" />
<p style="font-size: 12px; margin: 0;">PikWizard</p>
</a>
</span>
</span>
Free (free of charge)
Free for personal and commercial use.
Author: Awesome Content
Similar Free Stock Images

Premium


Premium


Premium


Premium


Premium


Premium


Premium


Premium


Premium


Premium


Premium


Premium


Premium


Premium


Premium


Premium


Premium


Premium


Premium


Premium


Premium


Premium


Premium


Premium