- Home >
- Stock Photos >
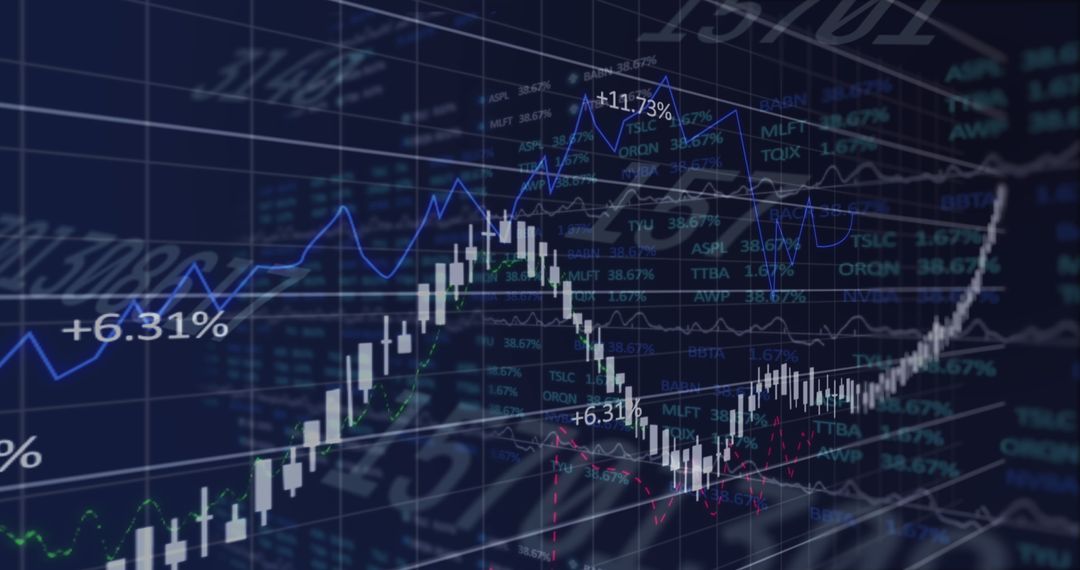
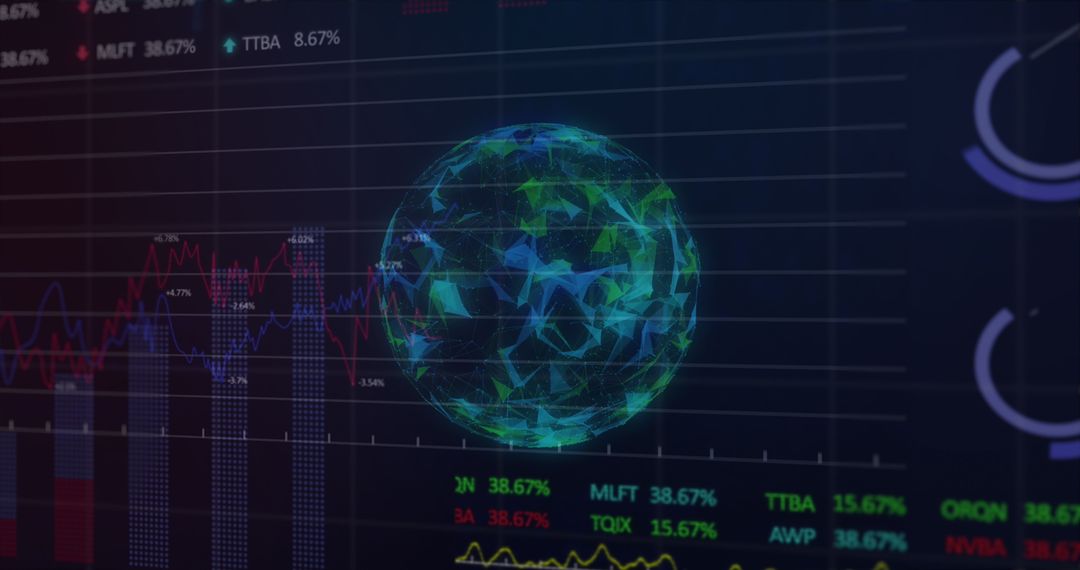
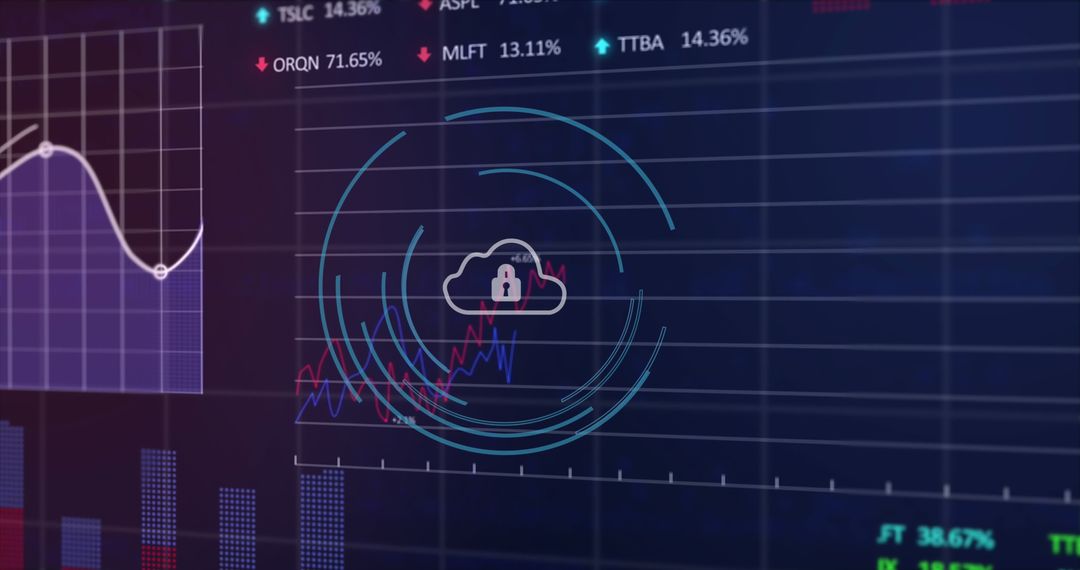
- Dynamic Holographic Report Display on Digital Trading Board
Dynamic Holographic Report Display on Digital Trading Board Image
This scene shows a futuristic digital display within a trading environment, incorporating holographic elements, moving numbers, graphs. Ideal for illustrating concepts related to data analytics, financial reporting, and modern business visualization technologies.
Powered by  - Get 15% off with code: PIKWIZARD15


2
downloads
downloads
Tags:
More
Credit Photo
If you would like to credit the Photo, here are some ways you can do so
Text Link
photo Link
<span class="text-link">
<span>
<a target="_blank" href=https://pikwizard.com/photo/dynamic-holographic-report-display-on-digital-trading-board/9dc6f89a6dec43ec6061da6fd885524c/>PikWizard</a>
</span>
</span>
<span class="image-link">
<span
style="margin: 0 0 20px 0; display: inline-block; vertical-align: middle; width: 100%;"
>
<a
target="_blank"
href="https://pikwizard.com/photo/dynamic-holographic-report-display-on-digital-trading-board/9dc6f89a6dec43ec6061da6fd885524c/"
style="text-decoration: none; font-size: 10px; margin: 0;"
>
<img src="https://pikwizard.com/pw/medium/9dc6f89a6dec43ec6061da6fd885524c.jpg" style="margin: 0; width: 100%;" alt="" />
<p style="font-size: 12px; margin: 0;">PikWizard</p>
</a>
</span>
</span>
Free (free of charge)
Free for personal and commercial use.
Author: Authentic Images
Similar Free Stock Images

Premium


Premium


Premium


Premium


Premium


Premium


Premium


Premium


Premium


Premium


Premium


Premium


Premium


Premium


Premium


Premium


Premium


Premium


Premium


Premium


Premium


Premium


Premium


Premium