- Home >
- Stock Photos >
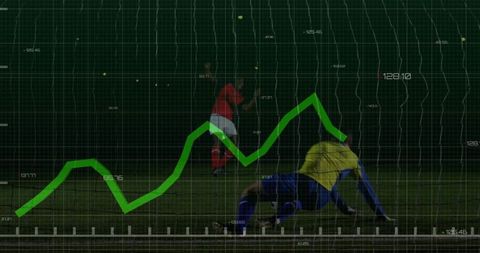
- Dynamic Horse Galloping Overlayed with Performance Line Graph
Dynamic Horse Galloping Overlayed with Performance Line Graph Image
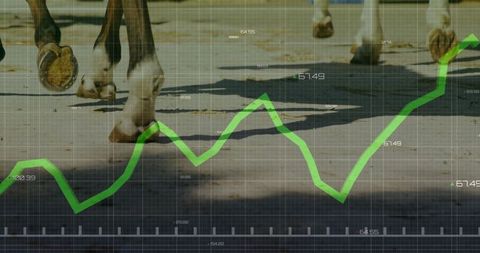
The dynamic scene shows galloping horse hooves kicking up dirt on an outdoor racing track, projected with a green performance line graph depicting data analysis. Useful for conveying themes of athletic performance enhancement, the intersection of sports and data analysis, or the dynamic nature of equine sports. Ideal for promoting investments in equine industry technologies, sports analysis tools, or in articles discussing the scientific methods in horse training and racing.

downloads
Tags:
More
Credit Photo
If you would like to credit the Photo, here are some ways you can do so
Text Link
photo Link
<span class="text-link">
<span>
<a target="_blank" href=https://pikwizard.com/photo/dynamic-horse-galloping-overlayed-with-performance-line-graph/b7b769291a8373349f811d2ca80b6f9a/>PikWizard</a>
</span>
</span>
<span class="image-link">
<span
style="margin: 0 0 20px 0; display: inline-block; vertical-align: middle; width: 100%;"
>
<a
target="_blank"
href="https://pikwizard.com/photo/dynamic-horse-galloping-overlayed-with-performance-line-graph/b7b769291a8373349f811d2ca80b6f9a/"
style="text-decoration: none; font-size: 10px; margin: 0;"
>
<img src="https://pikwizard.com/pw/medium/b7b769291a8373349f811d2ca80b6f9a.jpg" style="margin: 0; width: 100%;" alt="" />
<p style="font-size: 12px; margin: 0;">PikWizard</p>
</a>
</span>
</span>
Free (free of charge)
Free for personal and commercial use.
Author: People Creations