- Home >
- Stock Photos >
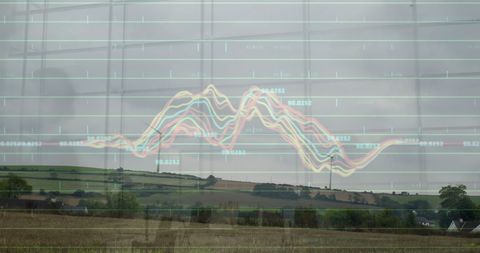
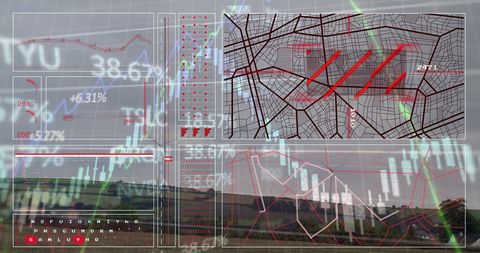
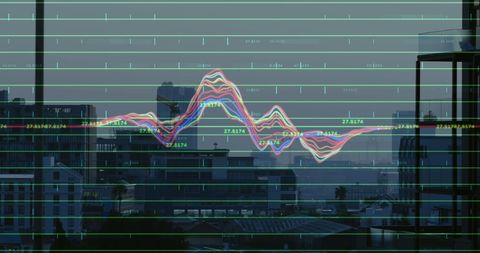
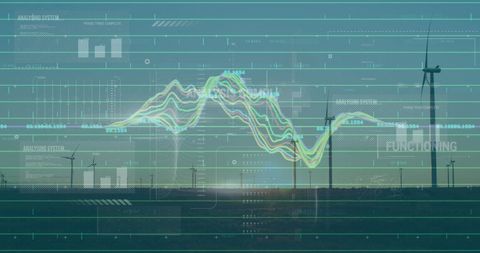
- Dynamic Infographic Interface with Multicolored Graphs and Speedometer
Dynamic Infographic Interface with Multicolored Graphs and Speedometer Image
Illustrating a futuristic digital composite of infographic elements including multicolored graphs, speedometer, and navigation symbols over a walkway scene with people. Used for depicting concepts related to data visualization, financial reports, and technological advancements. Ideal for presentations on analytics, tech interface design, or business innovation strategies.

downloads
Tags:
More
Credit Photo
If you would like to credit the Photo, here are some ways you can do so
Text Link
photo Link
<span class="text-link">
<span>
<a target="_blank" href=https://pikwizard.com/photo/dynamic-infographic-interface-with-multicolored-graphs-and-speedometer/571d7b8c99a7c03c7ddcf41af2438b96/>PikWizard</a>
</span>
</span>
<span class="image-link">
<span
style="margin: 0 0 20px 0; display: inline-block; vertical-align: middle; width: 100%;"
>
<a
target="_blank"
href="https://pikwizard.com/photo/dynamic-infographic-interface-with-multicolored-graphs-and-speedometer/571d7b8c99a7c03c7ddcf41af2438b96/"
style="text-decoration: none; font-size: 10px; margin: 0;"
>
<img src="https://pikwizard.com/pw/medium/571d7b8c99a7c03c7ddcf41af2438b96.jpg" style="margin: 0; width: 100%;" alt="" />
<p style="font-size: 12px; margin: 0;">PikWizard</p>
</a>
</span>
</span>
Free (free of charge)
Free for personal and commercial use.
Author: Authentic Images