
- Home >
- Stock Photos >
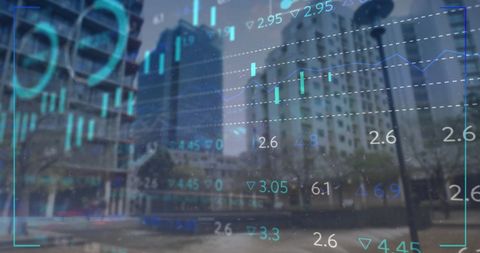
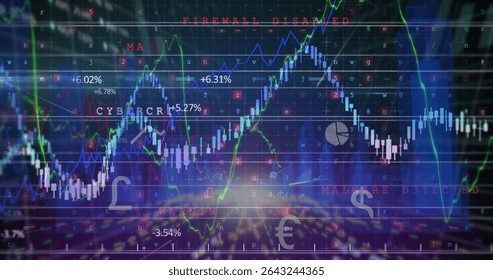
- Dynamic Interface Displaying Financial Data with Algorithms
Dynamic Interface Displaying Financial Data with Algorithms Image

This visualization captures a digital interface with intersecting code snippets and financial data overlays. With its blend of statistical graphs and algorithmic symbols, it embodies the intersection of technology and finance. Ideal for financial technology content, cryptocurrency articles, data analytics presentations, or digital finance concepts.
Powered by  - Get 15% off with code: PIKWIZARD15


downloads
Tags:
More
Credit Photo
If you would like to credit the Photo, here are some ways you can do so
Text Link
photo Link
<span class="text-link">
<span>
<a target="_blank" href=https://pikwizard.com/photo/dynamic-interface-displaying-financial-data-with-algorithms/e99cd0eda222313befcf42b9cd934b5c/>PikWizard</a>
</span>
</span>
<span class="image-link">
<span
style="margin: 0 0 20px 0; display: inline-block; vertical-align: middle; width: 100%;"
>
<a
target="_blank"
href="https://pikwizard.com/photo/dynamic-interface-displaying-financial-data-with-algorithms/e99cd0eda222313befcf42b9cd934b5c/"
style="text-decoration: none; font-size: 10px; margin: 0;"
>
<img src="https://pikwizard.com/pw/medium/e99cd0eda222313befcf42b9cd934b5c.jpg" style="margin: 0; width: 100%;" alt="" />
<p style="font-size: 12px; margin: 0;">PikWizard</p>
</a>
</span>
</span>
Free (free of charge)
Free for personal and commercial use.
Author: Creative Art
Similar Free Stock Images

Premium


Premium

Premium


Premium


Premium

Premium


Premium


Premium


Premium

Premium
Premium

Premium


Premium


Premium


Premium


Premium


Premium


Premium


Premium


Premium


Premium


Premium

Premium


Premium


Premium


Explore More Free Stock Images