- Home >
- Stock Photos >
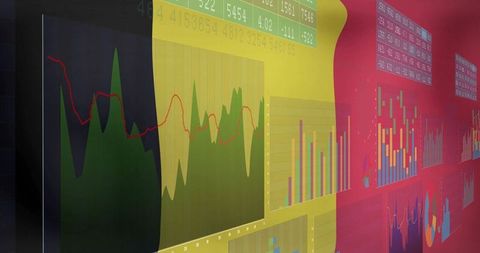
- Dynamic Interface Displaying Real-Time Statistical Data Charts
Dynamic Interface Displaying Real-Time Statistical Data Charts Image

Finance and technology sectors can leverage this conceptual design to visualize real-time data analysis. The digital layout displays various charts and graphs, making it ideal for presentations on business intelligence, data-driven decision-making, and informational reports in industries focusing on statistics, economics, and tech transformation.

downloads
Tags:
More
Credit Photo
If you would like to credit the Photo, here are some ways you can do so
Text Link
photo Link
<span class="text-link">
<span>
<a target="_blank" href=https://pikwizard.com/photo/dynamic-interface-displaying-real-time-statistical-data-charts/5ed166eb17cf0faa00e1a648e85608c2/>PikWizard</a>
</span>
</span>
<span class="image-link">
<span
style="margin: 0 0 20px 0; display: inline-block; vertical-align: middle; width: 100%;"
>
<a
target="_blank"
href="https://pikwizard.com/photo/dynamic-interface-displaying-real-time-statistical-data-charts/5ed166eb17cf0faa00e1a648e85608c2/"
style="text-decoration: none; font-size: 10px; margin: 0;"
>
<img src="https://pikwizard.com/pw/medium/5ed166eb17cf0faa00e1a648e85608c2.jpg" style="margin: 0; width: 100%;" alt="" />
<p style="font-size: 12px; margin: 0;">PikWizard</p>
</a>
</span>
</span>
Free (free of charge)
Free for personal and commercial use.
Author: People Creations