
- Home >
- Stock Photos >
- Dynamic Line Chart Overlaying City Skyline During Dusk with Data Visualization
Dynamic Line Chart Overlaying City Skyline During Dusk with Data Visualization Image
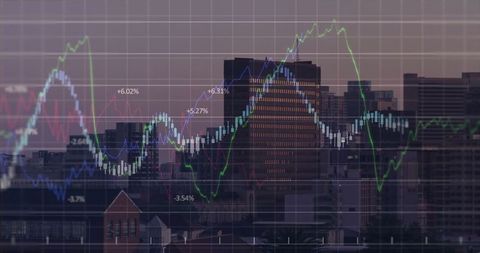
Line graphs and candlestick bars with percentages float over a city's skyline as the sun sets, symbolizing investment growth and analytics in an urban context. The combination of data representations with the city background makes it great for conveying themes of modern corporate development, economic projections, and urban analytics innovations. Suitable for use in business blogs, presentations related to finance, economic research articles, and investment-oriented publications.
Powered by  - Get 15% off with code: PIKWIZARD15


downloads
Tags:
More
Credit Photo
If you would like to credit the Photo, here are some ways you can do so
Text Link
photo Link
<span class="text-link">
<span>
<a target="_blank" href=https://pikwizard.com/photo/dynamic-line-chart-overlaying-city-skyline-during-dusk-with-data-visualization/4e58214bd813c9414d11af03e7961dc9/>PikWizard</a>
</span>
</span>
<span class="image-link">
<span
style="margin: 0 0 20px 0; display: inline-block; vertical-align: middle; width: 100%;"
>
<a
target="_blank"
href="https://pikwizard.com/photo/dynamic-line-chart-overlaying-city-skyline-during-dusk-with-data-visualization/4e58214bd813c9414d11af03e7961dc9/"
style="text-decoration: none; font-size: 10px; margin: 0;"
>
<img src="https://pikwizard.com/pw/medium/4e58214bd813c9414d11af03e7961dc9.jpg" style="margin: 0; width: 100%;" alt="" />
<p style="font-size: 12px; margin: 0;">PikWizard</p>
</a>
</span>
</span>
Free (free of charge)
Free for personal and commercial use.
Author: Awesome Content