- Home >
- Stock Photos >
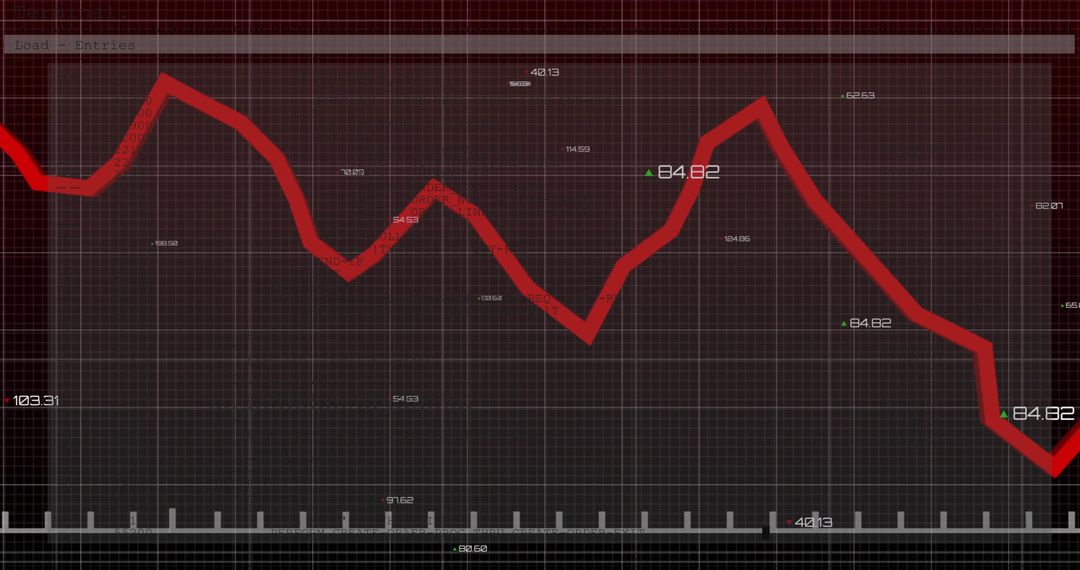
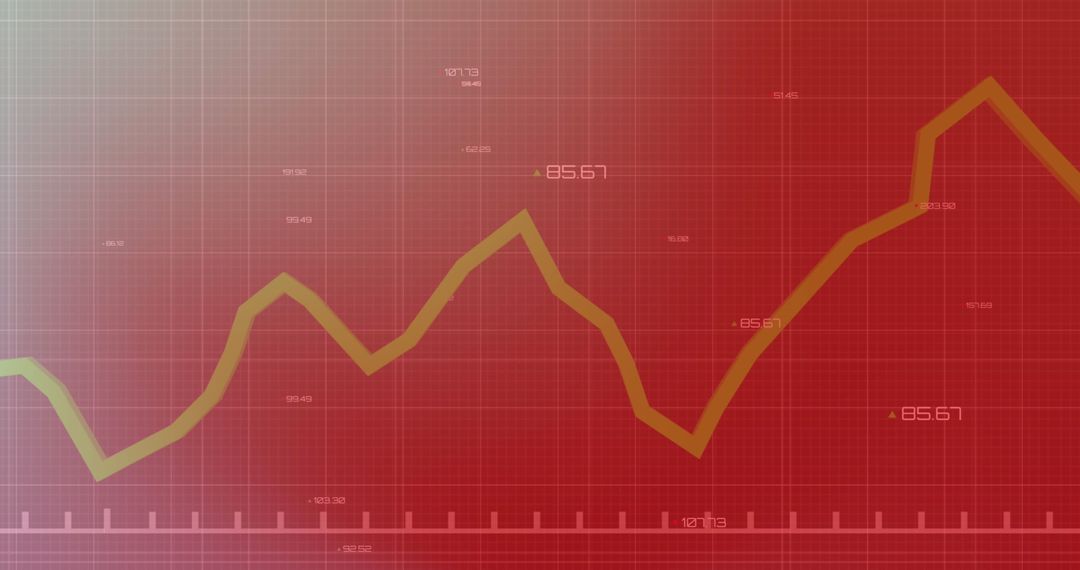
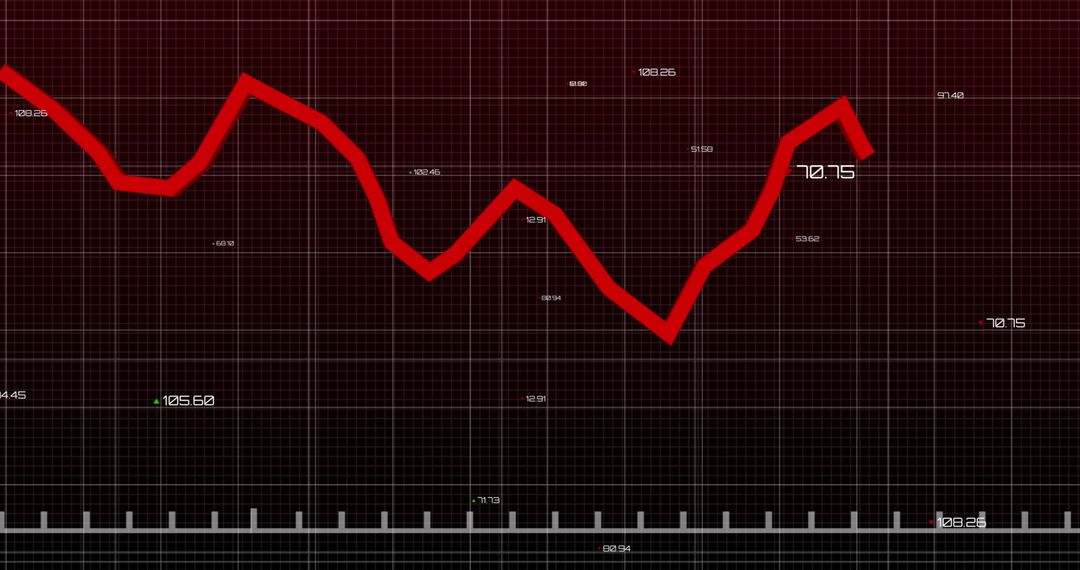
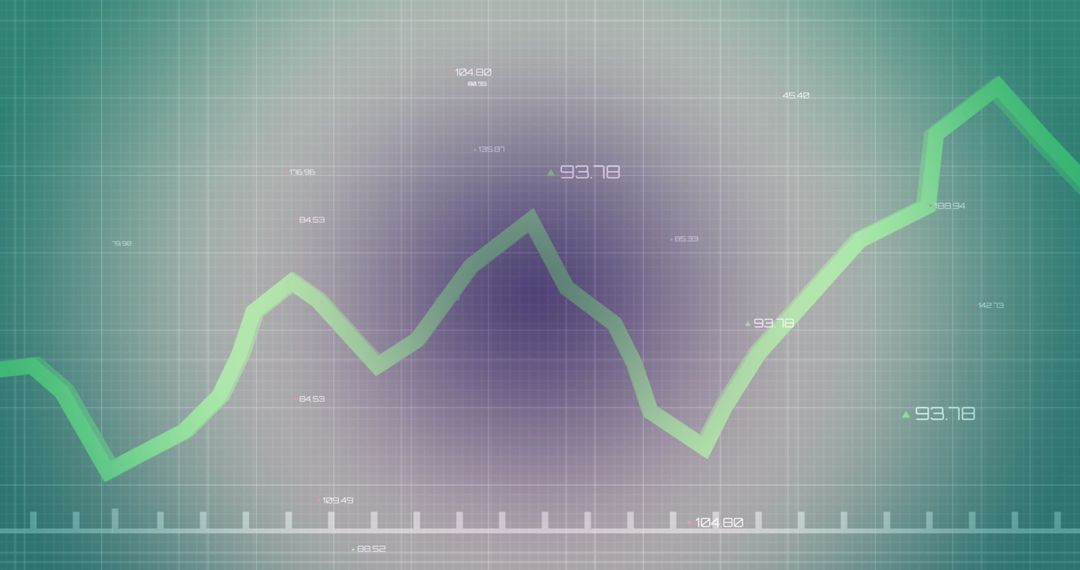
- Dynamic Line Chart Representing Financial Data Growth
Dynamic Line Chart Representing Financial Data Growth Image

This digital chart illustrates fluctuating financial data on a dark, high-tech background. The dynamic design highlights growth trends and analytics concepts. Ideal for presentations on financial performance, stock market analysis, economic development planning, or data-driven decision making, showcasing important metrics with numeric labels.
Powered by 


0
downloads
downloads
Tags:
More
Credit Photo
If you would like to credit the Photo, here are some ways you can do so
Text Link
photo Link
<span class="text-link">
<span>
<a target="_blank" href=https://pikwizard.com/photo/dynamic-line-chart-representing-financial-data-growth/5b4f964b3b6001b87b9b678767667d0c/>PikWizard</a>
</span>
</span>
<span class="image-link">
<span
style="margin: 0 0 20px 0; display: inline-block; vertical-align: middle; width: 100%;"
>
<a
target="_blank"
href="https://pikwizard.com/photo/dynamic-line-chart-representing-financial-data-growth/5b4f964b3b6001b87b9b678767667d0c/"
style="text-decoration: none; font-size: 10px; margin: 0;"
>
<img src="https://pikwizard.com/pw/medium/5b4f964b3b6001b87b9b678767667d0c.jpg" style="margin: 0; width: 100%;" alt="" />
<p style="font-size: 12px; margin: 0;">PikWizard</p>
</a>
</span>
</span>
Free (free of charge)
Free for personal and commercial use.
Author: People Creations
Similar Free Stock Images
Premium


Premium


Premium


Premium


Premium


Premium


Premium


Premium


Premium


Premium


Premium


Premium


Premium


Premium


Premium


Premium


Premium


Premium


Premium


Premium


Premium


Premium


Premium


Premium