
- Home >
- Free Stock Photos & Images >
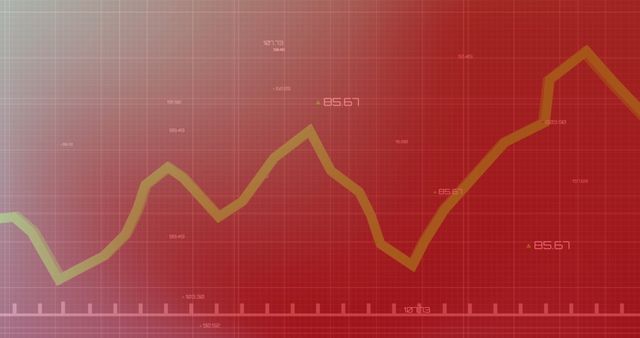
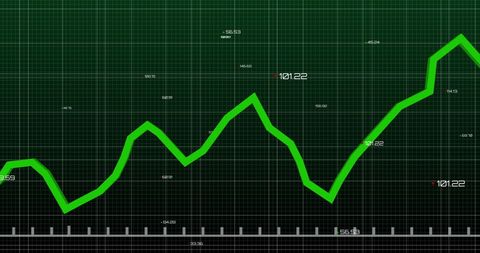
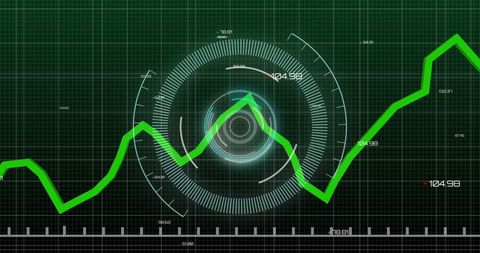
- Dynamic Line Chart Representing Financial Data Growth
Dynamic Line Chart Representing Financial Data Growth Free Stock Image

This digital chart illustrates fluctuating financial data on a dark, high-tech background. The dynamic design highlights growth trends and analytics concepts. Ideal for presentations on financial performance, stock market analysis, economic development planning, or data-driven decision making, showcasing important metrics with numeric labels.
Powered by  - Get 15% off with code: PIKWIZARD15


downloads
Tags:
More
Credit Photo
If you would like to credit the Photo, here are some ways you can do so
Text Link
photo Link
<span class="text-link">
<span>
<a target="_blank" href=https://pikwizard.com/photo/dynamic-line-chart-representing-financial-data-growth/5b4f964b3b6001b87b9b678767667d0c/>PikWizard</a>
</span>
</span>
<span class="image-link">
<span
style="margin: 0 0 20px 0; display: inline-block; vertical-align: middle; width: 100%;"
>
<a
target="_blank"
href="https://pikwizard.com/photo/dynamic-line-chart-representing-financial-data-growth/5b4f964b3b6001b87b9b678767667d0c/"
style="text-decoration: none; font-size: 10px; margin: 0;"
>
<img src="https://thumbs.wbm.im/pw/medium/5b4f964b3b6001b87b9b678767667d0c.jpg" style="margin: 0; width: 100%;" alt="Dynamic Line Chart Representing Financial Data Growth" />
<p style="font-size: 12px; margin: 0;">PikWizard</p>
</a>
</span>
</span>
Free (free of charge)
Free for personal and commercial use.
Author: People Creations
Similar Free Stock Images


Premium


Premium


Premium


Premium


Premium


Premium


Premium


Premium


Premium


Premium


Premium


Premium


Premium


Premium


Premium


Premium


Premium


Premium


Premium


Premium


Premium


Premium


Premium


Premium


Premium

Explore More Free Stock Images