
- Home >
- Stock Photos >
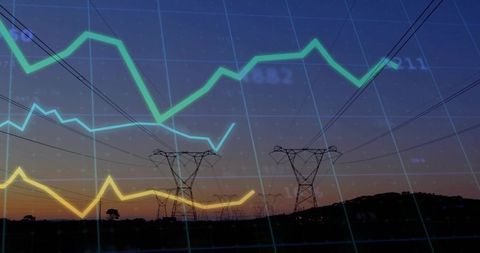
- Dynamic Line Graph on Digital Data Background for Financial Analytics
Dynamic Line Graph on Digital Data Background for Financial Analytics Image

A visual representation of a green and yellow line graph overlaid on a dynamic digital data background, illustrating concepts of financial analytics, data statistics, and technology visualization. Ideal for use in presentations, reports, or websites related to finance, technology growth, or data visualization. This suggests a progressive and analytical approach utilizing contemporary digital solutions.
Powered by  - Get 15% off with code: PIKWIZARD15


downloads
Tags:
More
Credit Photo
If you would like to credit the Photo, here are some ways you can do so
Text Link
photo Link
<span class="text-link">
<span>
<a target="_blank" href=https://pikwizard.com/photo/dynamic-line-graph-on-digital-data-background-for-financial-analytics/d7da51c0792959cffc75395ec80f1831/>PikWizard</a>
</span>
</span>
<span class="image-link">
<span
style="margin: 0 0 20px 0; display: inline-block; vertical-align: middle; width: 100%;"
>
<a
target="_blank"
href="https://pikwizard.com/photo/dynamic-line-graph-on-digital-data-background-for-financial-analytics/d7da51c0792959cffc75395ec80f1831/"
style="text-decoration: none; font-size: 10px; margin: 0;"
>
<img src="https://pikwizard.com/pw/medium/d7da51c0792959cffc75395ec80f1831.jpg" style="margin: 0; width: 100%;" alt="" />
<p style="font-size: 12px; margin: 0;">PikWizard</p>
</a>
</span>
</span>
Free (free of charge)
Free for personal and commercial use.
Author: People Creations
Similar Free Stock Images

Premium

Premium

Premium


Premium


Premium


Premium


Premium


Premium


Premium

Premium

Premium

Premium


Premium


Premium


Premium


Premium


Premium


Premium


Premium


Premium


Premium


Premium


Premium


Premium


Premium


Explore More Free Stock Images