- Home >
- Stock Photos >
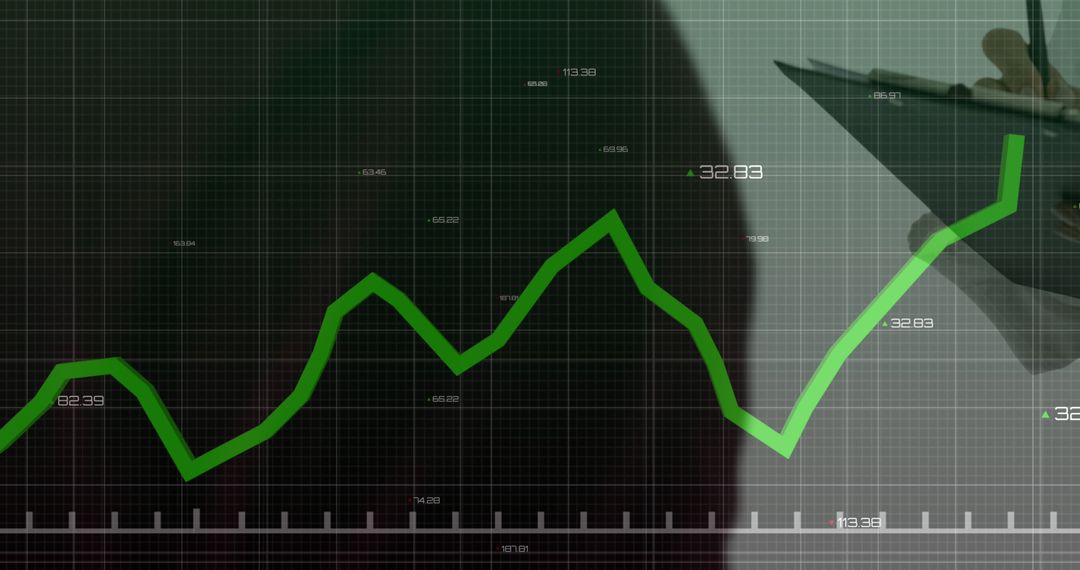
- Dynamic Line Graph on Industrial Background Illustrating Data Trends
Dynamic Line Graph on Industrial Background Illustrating Data Trends Image

Green line graph against a blurred industrial setting demonstrates dynamic data trends and analytics. Colorful labels display numeric fluctuations emphasizing technological and financial precision. Perfect for presentations and reports on industrial technology, data analytics, economic changes, and strategic business insights.
Powered by  - Get 15% off with code: PIKWIZARD15


0
downloads
downloads
Tags:
More
Credit Photo
If you would like to credit the Photo, here are some ways you can do so
Text Link
photo Link
<span class="text-link">
<span>
<a target="_blank" href=https://pikwizard.com/photo/dynamic-line-graph-on-industrial-background-illustrating-data-trends/0d542b765244b1005977ee7d0aa12d3a/>PikWizard</a>
</span>
</span>
<span class="image-link">
<span
style="margin: 0 0 20px 0; display: inline-block; vertical-align: middle; width: 100%;"
>
<a
target="_blank"
href="https://pikwizard.com/photo/dynamic-line-graph-on-industrial-background-illustrating-data-trends/0d542b765244b1005977ee7d0aa12d3a/"
style="text-decoration: none; font-size: 10px; margin: 0;"
>
<img src="https://pikwizard.com/pw/medium/0d542b765244b1005977ee7d0aa12d3a.jpg" style="margin: 0; width: 100%;" alt="" />
<p style="font-size: 12px; margin: 0;">PikWizard</p>
</a>
</span>
</span>
Free (free of charge)
Free for personal and commercial use.
Author: Authentic Images
Similar Free Stock Images
Premium


Premium


Premium


Premium


Premium


Premium


Premium


Premium


Premium


Premium


Premium


Premium


Premium


Premium


Premium


Premium


Premium


Premium


Premium


Premium


Premium


Premium


Premium


Premium