
- Home >
- Stock Photos >
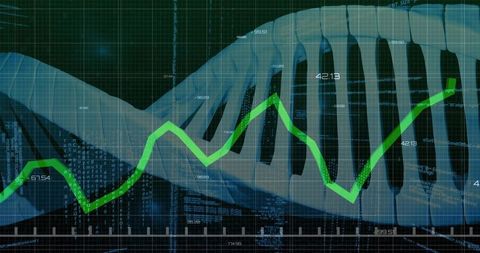
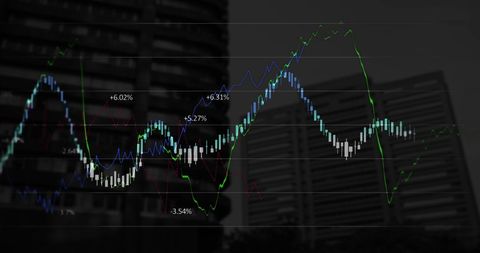
- Dynamic Line Graph Transmits Data in Modern Office Environment
Dynamic Line Graph Transmits Data in Modern Office Environment Image

Visually representing financial data in modern office conveys real-time analytics and trends essential for business strategy. Ideal for marketing digital solutions in financial technology or investing semantically. Useful for web design, business presentations, educational materials.
Powered by 


downloads
Tags:
More
Credit Photo
If you would like to credit the Photo, here are some ways you can do so
Text Link
photo Link
<span class="text-link">
<span>
<a target="_blank" href=https://pikwizard.com/photo/dynamic-line-graph-transmits-data-in-modern-office-environment/42aa37a24f872ff877c9d30feb6c8b72/>PikWizard</a>
</span>
</span>
<span class="image-link">
<span
style="margin: 0 0 20px 0; display: inline-block; vertical-align: middle; width: 100%;"
>
<a
target="_blank"
href="https://pikwizard.com/photo/dynamic-line-graph-transmits-data-in-modern-office-environment/42aa37a24f872ff877c9d30feb6c8b72/"
style="text-decoration: none; font-size: 10px; margin: 0;"
>
<img src="https://pikwizard.com/pw/medium/42aa37a24f872ff877c9d30feb6c8b72.jpg" style="margin: 0; width: 100%;" alt="" />
<p style="font-size: 12px; margin: 0;">PikWizard</p>
</a>
</span>
</span>
Free (free of charge)
Free for personal and commercial use.
Author: People Creations
Similar Free Stock Images
Loading...

Premium


Premium


Premium

Premium


Premium


Premium

Premium


Premium


Premium


Premium


Premium


Premium

Premium

Premium


Premium


Premium


Premium


Premium


Premium


Premium


Premium


Premium


Premium


Premium


Premium
