
- Home >
- Stock Photos >
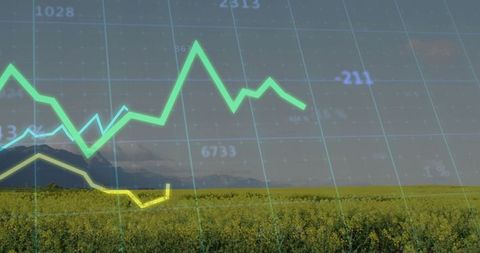
- Dynamic Line Graphs Display on Transparent Digital Analytics Screen
Dynamic Line Graphs Display on Transparent Digital Analytics Screen Image

Vivid representation of fluctuating data emphasizes dynamic sector changes or investment trends. Useful for articles on financial analysis, economic reports, presentations involving technology in statistics, or marketing visuals focused on data-centric innovations.
Powered by  - Get 15% off with code: PIKWIZARD15


downloads
Tags:
More
Credit Photo
If you would like to credit the Photo, here are some ways you can do so
Text Link
photo Link
<span class="text-link">
<span>
<a target="_blank" href=https://pikwizard.com/photo/dynamic-line-graphs-display-on-transparent-digital-analytics-screen/2db39dc28691e3b08793db451c52f03d/>PikWizard</a>
</span>
</span>
<span class="image-link">
<span
style="margin: 0 0 20px 0; display: inline-block; vertical-align: middle; width: 100%;"
>
<a
target="_blank"
href="https://pikwizard.com/photo/dynamic-line-graphs-display-on-transparent-digital-analytics-screen/2db39dc28691e3b08793db451c52f03d/"
style="text-decoration: none; font-size: 10px; margin: 0;"
>
<img src="https://pikwizard.com/pw/medium/2db39dc28691e3b08793db451c52f03d.jpg" style="margin: 0; width: 100%;" alt="" />
<p style="font-size: 12px; margin: 0;">PikWizard</p>
</a>
</span>
</span>
Free (free of charge)
Free for personal and commercial use.
Author: People Creations
Similar Free Stock Images

Premium


Premium


Premium


Premium


Premium


Premium


Premium

Premium


Premium


Premium


Premium


Premium


Premium


Premium


Premium

Premium


Premium


Premium


Premium


Premium


Premium

Premium


Premium


Premium


Premium


Explore More Free Stock Images