
- Home >
- Stock Photos >
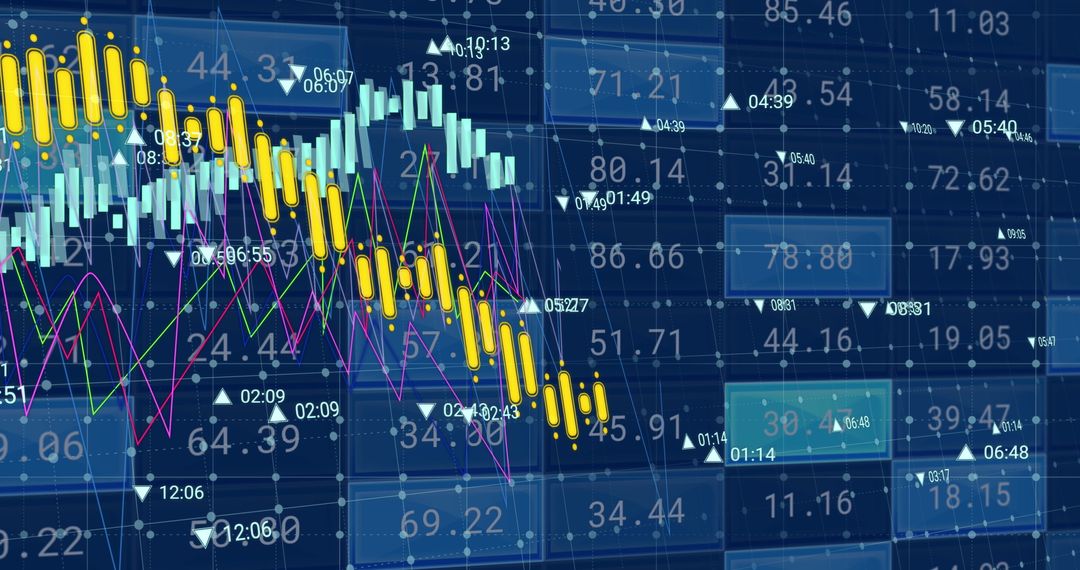
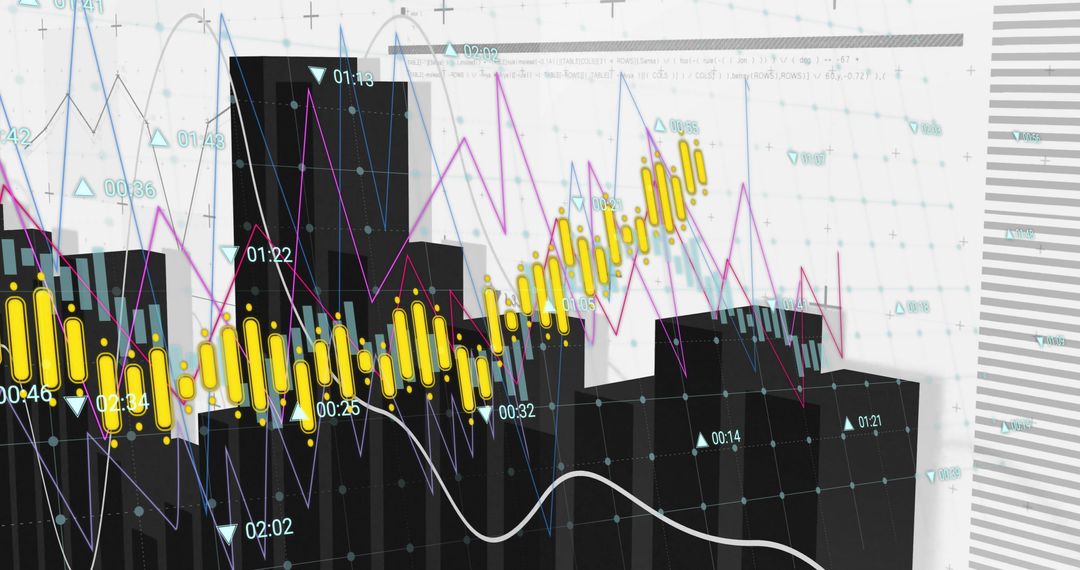
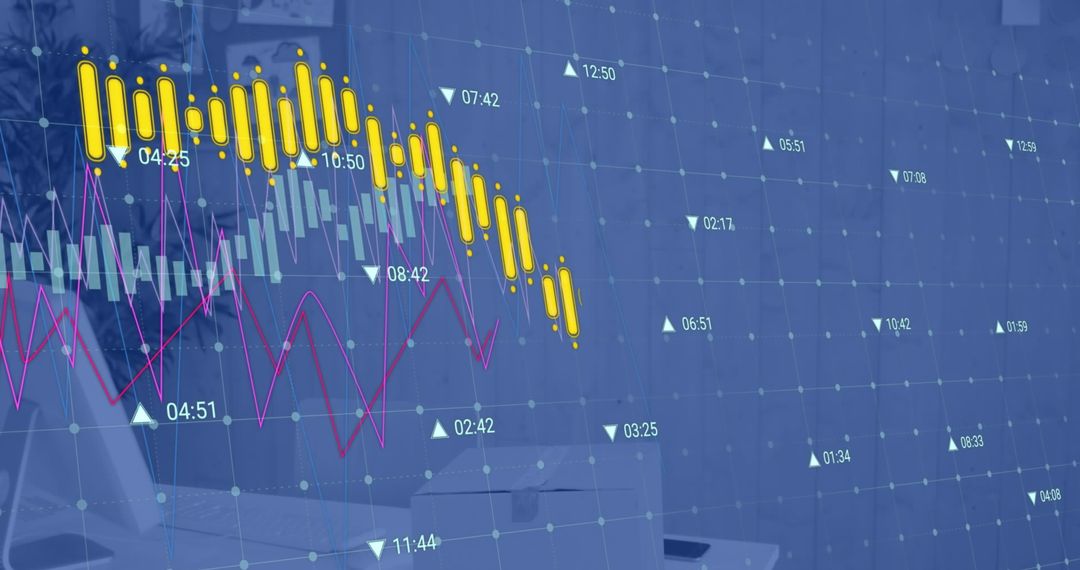
- Dynamic Market Dashboard Showing Candlestick Charts, Trend Lines and Trading Indicators
Dynamic Market Dashboard Showing Candlestick Charts, Trend Lines and Trading Indicators Image

Dark digital dashboard showing yellow and cyan candlestick bars, multiple moving average lines, magenta and blue trend curves, glowing nodes and numeric time labels. High-contrast composition emphasizing market volatility and downward trend on right side while central area contains dense trading activity. Clean grid and data points supporting technical analysis and trading indicator themes. Serving financial websites, powering trading platform banners, enhancing fintech app heroes, supporting presentation slides, enriching investor reports, topping blog headers, driving social media ads, illustrating stock market tutorials, leading online course thumbnails. Cropping for header or hero layouts; leaving space on right for headline or call-to-action. Adjusting color palette to match brand; animating candlesticks for video or interactive data visualizations. Providing alt text for accessibility and including keyword tags for SEO.
Powered by  - Get 15% off with code: PIKWIZARD15


0
downloads
downloads
Tags:
More
Credit Photo
If you would like to credit the Photo, here are some ways you can do so
Text Link
photo Link
<span class="text-link">
<span>
<a target="_blank" href=https://pikwizard.com/photo/dynamic-market-dashboard-showing-candlestick-charts-trend-lines-and-trading-indicators/55bf69147773f607c5151d8f6463920c/>PikWizard</a>
</span>
</span>
<span class="image-link">
<span
style="margin: 0 0 20px 0; display: inline-block; vertical-align: middle; width: 100%;"
>
<a
target="_blank"
href="https://pikwizard.com/photo/dynamic-market-dashboard-showing-candlestick-charts-trend-lines-and-trading-indicators/55bf69147773f607c5151d8f6463920c/"
style="text-decoration: none; font-size: 10px; margin: 0;"
>
<img src="https://pikwizard.com/pw/medium/55bf69147773f607c5151d8f6463920c.jpg" style="margin: 0; width: 100%;" alt="" />
<p style="font-size: 12px; margin: 0;">PikWizard</p>
</a>
</span>
</span>
Free (free of charge)
Free for personal and commercial use.
Author: Authentic Images
Similar Free Stock Images

Premium


Premium


Premium


Premium


Premium


Premium


Premium


Premium


Premium


Premium


Premium


Premium


Premium


Premium


Premium


Premium


Premium


Premium


Premium


Premium


Premium


Premium


Premium


Premium

