- Home >
- Stock Photos >
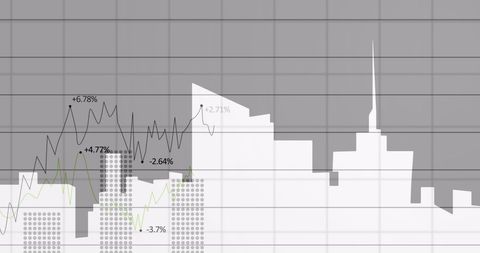
- Dynamic Monochromatic Data Visualization
Dynamic Monochromatic Data Visualization Image

The visual depicts a monochromatic stacked area chart in combination with a circle graph, overlaid on a grid background. Ideal for presenting complex data comparisons and trends, the design serves as an effective infographic element in business analytics presentations, websites focusing on data analytics or finance reports products.

downloads
Credit Photo
If you would like to credit the Photo, here are some ways you can do so
Text Link
photo Link
<span class="text-link">
<span>
<a target="_blank" href=https://pikwizard.com/photo/dynamic-monochromatic-data-visualization/e1a4a2630962fe4579332099c68ca726/>PikWizard</a>
</span>
</span>
<span class="image-link">
<span
style="margin: 0 0 20px 0; display: inline-block; vertical-align: middle; width: 100%;"
>
<a
target="_blank"
href="https://pikwizard.com/photo/dynamic-monochromatic-data-visualization/e1a4a2630962fe4579332099c68ca726/"
style="text-decoration: none; font-size: 10px; margin: 0;"
>
<img src="https://pikwizard.com/pw/medium/e1a4a2630962fe4579332099c68ca726.jpg" style="margin: 0; width: 100%;" alt="" />
<p style="font-size: 12px; margin: 0;">PikWizard</p>
</a>
</span>
</span>
Free (free of charge)
Free for personal and commercial use.
Author: Creative Art