- Home >
- Stock Photos >
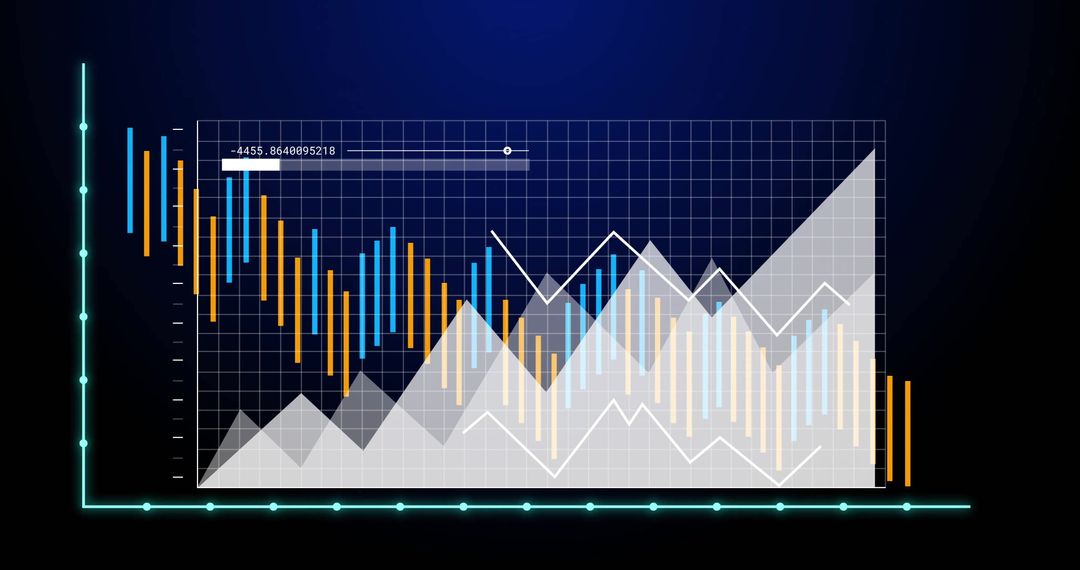
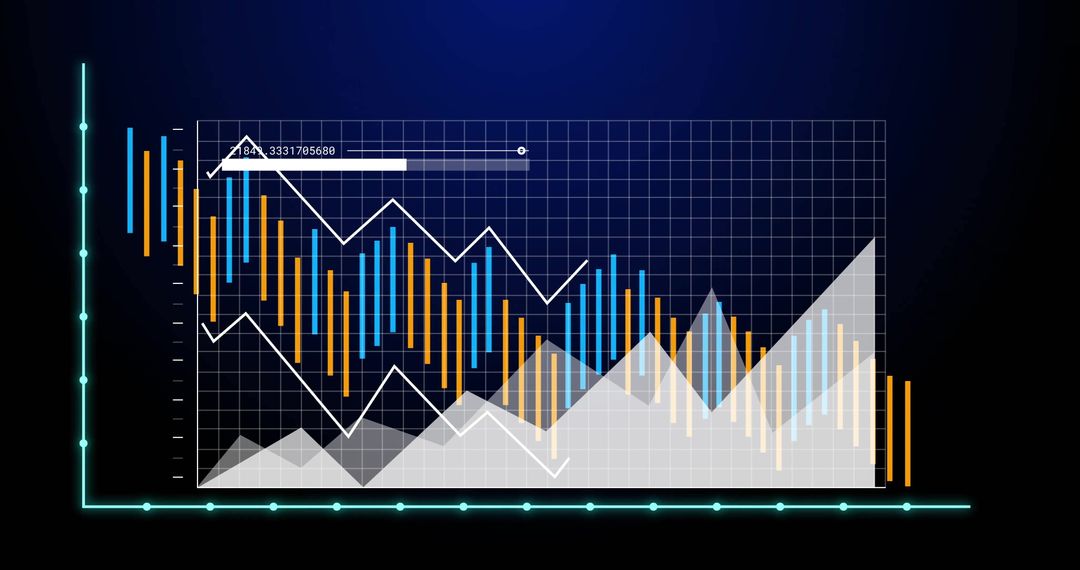
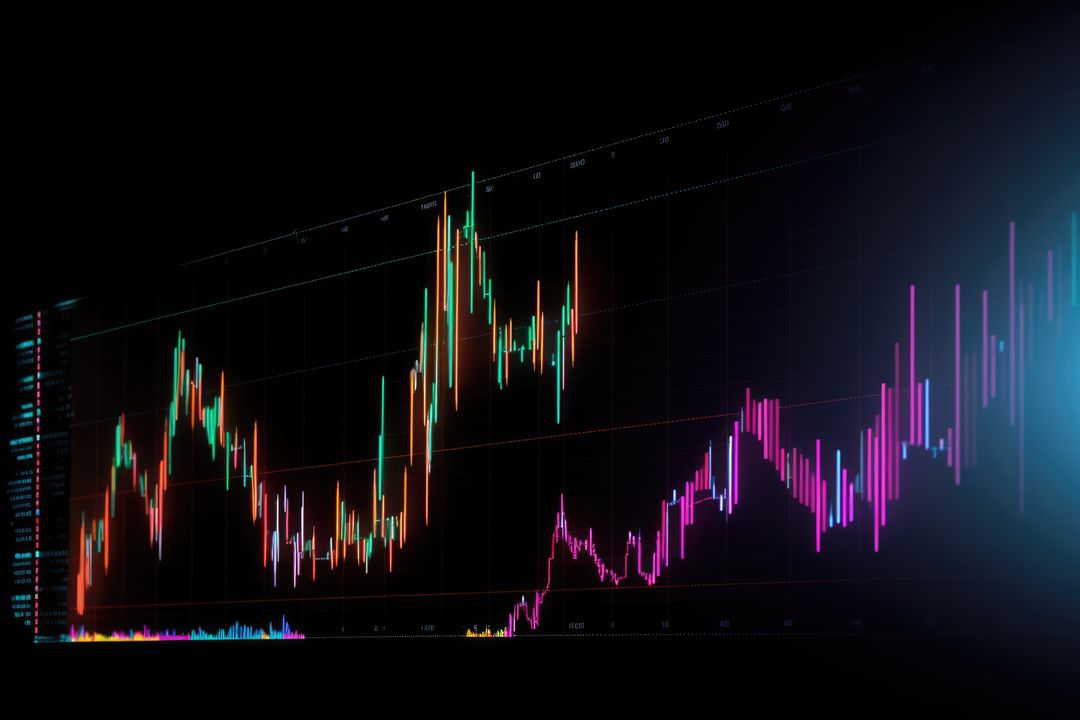
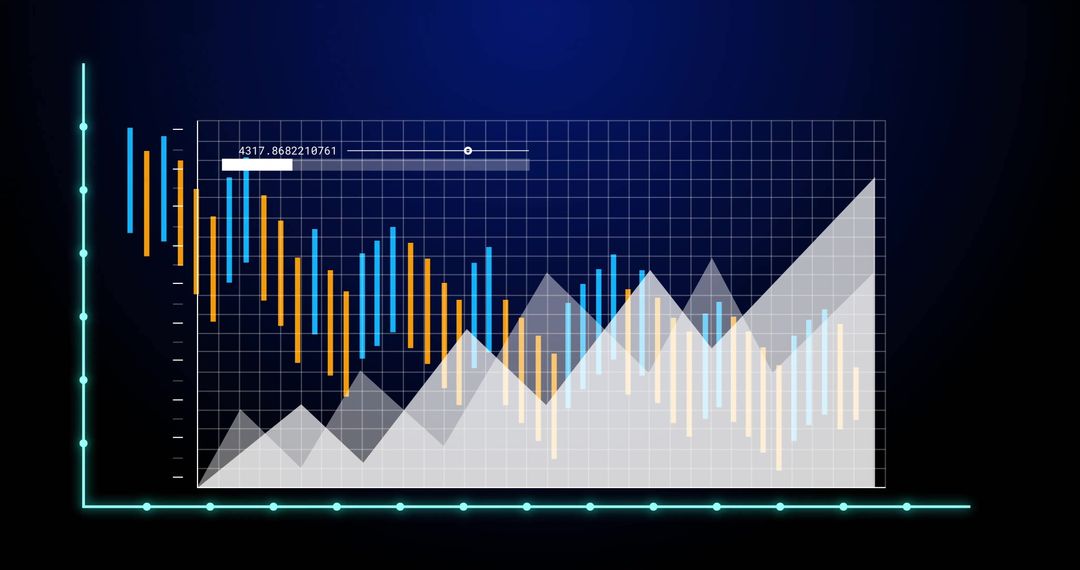
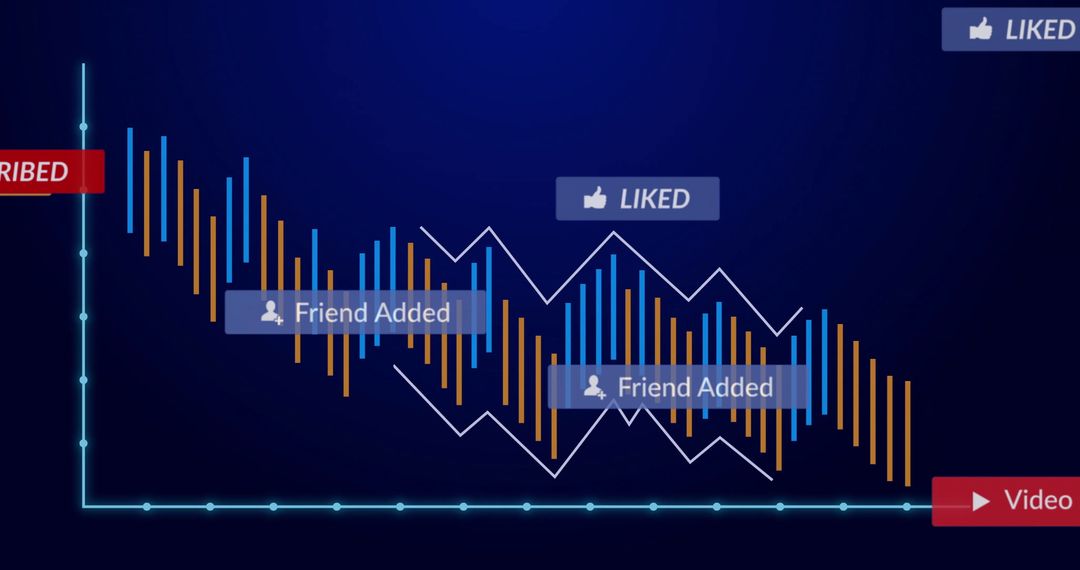
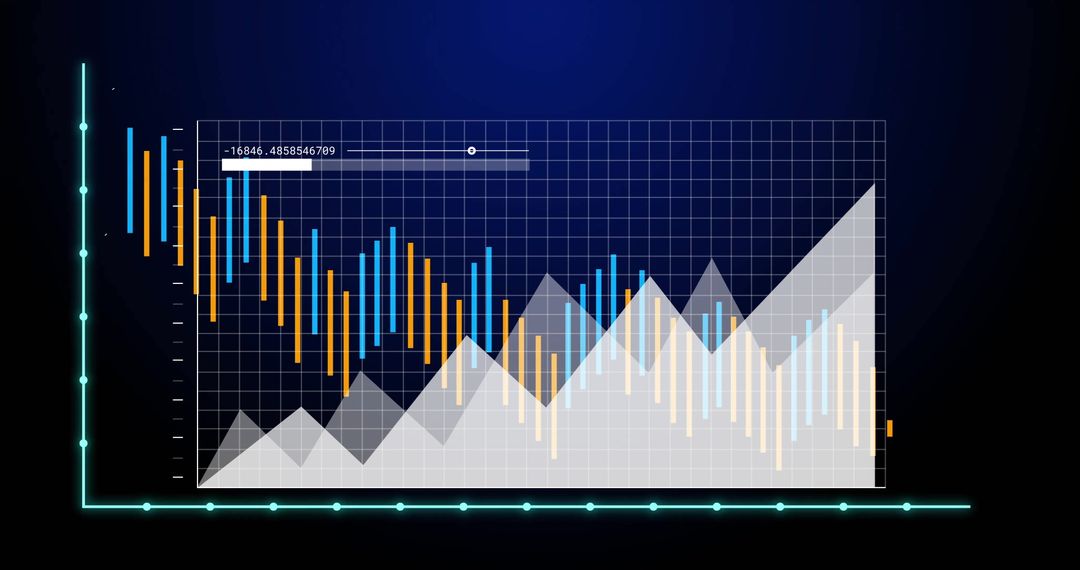
- Dynamic Multi Series Chart with Blue and Orange Bars on Dark Background
Dynamic Multi Series Chart with Blue and Orange Bars on Dark Background Image
Multi series chart depicting analytics in orange and blue bars on dark backdrop with a cyan axis. Capturing simultaneous data streams for analysis, suitable for business reports. Ideal for articles or presentations focusing on trends, market analysis, or insights into complex datasets. Useful in technology-centric articles and professional environments where illustrating quantitative analysis is necessary.

0
downloads
downloads
Tags:
More
Credit Photo
If you would like to credit the Photo, here are some ways you can do so
Text Link
photo Link
<span class="text-link">
<span>
<a target="_blank" href=https://pikwizard.com/photo/dynamic-multi-series-chart-with-blue-and-orange-bars-on-dark-background/cd676f028b931b1e9a323cb21ad3d6eb/>PikWizard</a>
</span>
</span>
<span class="image-link">
<span
style="margin: 0 0 20px 0; display: inline-block; vertical-align: middle; width: 100%;"
>
<a
target="_blank"
href="https://pikwizard.com/photo/dynamic-multi-series-chart-with-blue-and-orange-bars-on-dark-background/cd676f028b931b1e9a323cb21ad3d6eb/"
style="text-decoration: none; font-size: 10px; margin: 0;"
>
<img src="https://pikwizard.com/pw/medium/cd676f028b931b1e9a323cb21ad3d6eb.jpg" style="margin: 0; width: 100%;" alt="" />
<p style="font-size: 12px; margin: 0;">PikWizard</p>
</a>
</span>
</span>
Free (free of charge)
Free for personal and commercial use.
Author: Creative Art
Similar Free Stock Images