- Home >
- Stock Photos >
- Dynamic Multicolor Waveform on Digital Data Dashboard
Dynamic Multicolor Waveform on Digital Data Dashboard Image

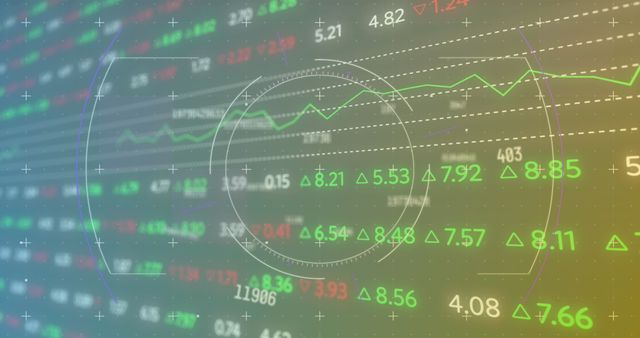
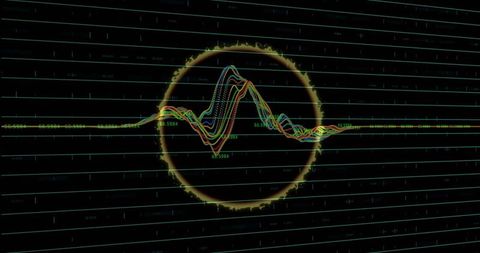
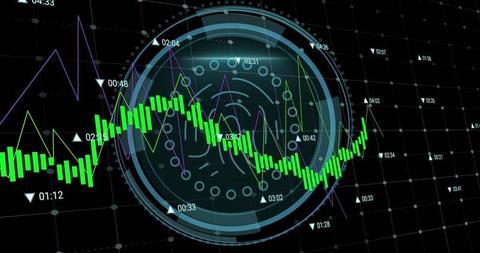
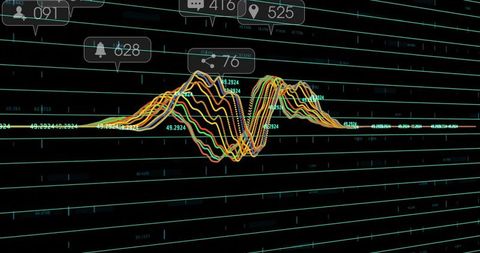
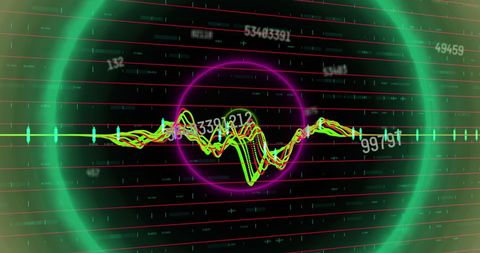
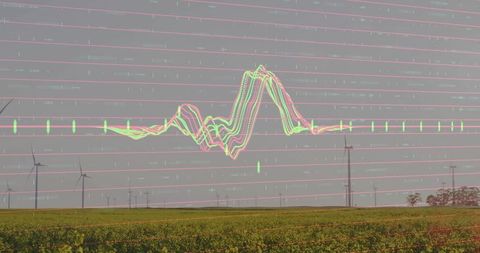
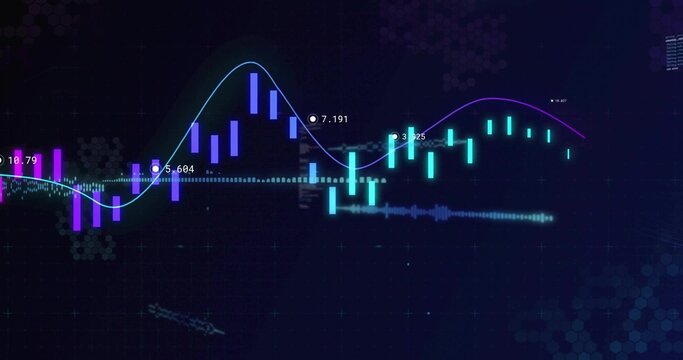
Vibrant depiction of multicolor waveform and candlestick chart intermingling over a red grid background, complemented with HUD circular elements. Suitable for illustrating concepts related to technical analysis, financial markets, and advanced data techniques. Ideal for digital spreads, financial reports, and tech presentations.
Powered by 


downloads
Tags:
More
Credit Photo
If you would like to credit the Photo, here are some ways you can do so
Text Link
photo Link
<span class="text-link">
<span>
<a target="_blank" href=https://pikwizard.com/photo/dynamic-multicolor-waveform-on-digital-data-dashboard/b204e1011223400d819fcdf656a890da/>PikWizard</a>
</span>
</span>
<span class="image-link">
<span
style="margin: 0 0 20px 0; display: inline-block; vertical-align: middle; width: 100%;"
>
<a
target="_blank"
href="https://pikwizard.com/photo/dynamic-multicolor-waveform-on-digital-data-dashboard/b204e1011223400d819fcdf656a890da/"
style="text-decoration: none; font-size: 10px; margin: 0;"
>
<img src="https://pikwizard.com/pw/medium/b204e1011223400d819fcdf656a890da.jpg" style="margin: 0; width: 100%;" alt="" />
<p style="font-size: 12px; margin: 0;">PikWizard</p>
</a>
</span>
</span>
Free (free of charge)
Free for personal and commercial use.
Author: People Creations