
- Home >
- Stock Photos >
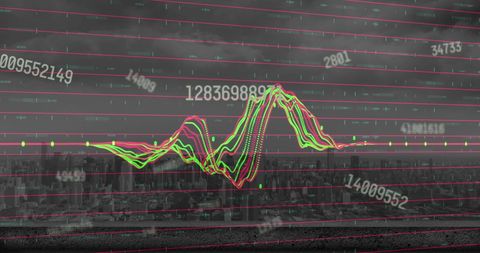
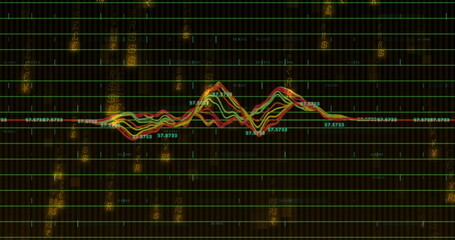
- Dynamic Multicolored Waveform Graph on Digital Dashboard
Dynamic Multicolored Waveform Graph on Digital Dashboard Image
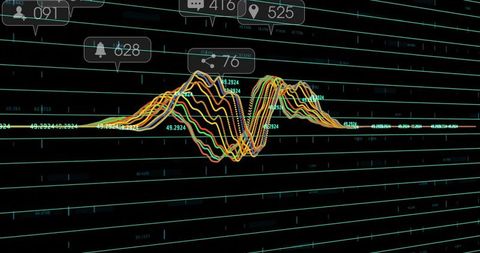
Visual presents a dynamic multicolored waveform graph streaming vibrantly across a digital dashboard, enhanced with user interface icons and numeric labels. Ideal for presentations or content relating to data analysis and technological advancements, this visualization captures the essence of modern analytics and real-time information. Useful for designers and professionals in data science, encouraging engagement and deeper understanding of insights through a visually appealing display.
Powered by 


downloads
Tags:
More
Credit Photo
If you would like to credit the Photo, here are some ways you can do so
Text Link
photo Link
<span class="text-link">
<span>
<a target="_blank" href=https://pikwizard.com/photo/dynamic-multicolored-waveform-graph-on-digital-dashboard/b4f645ad32c0e9c94d33f2572eb9d394/>PikWizard</a>
</span>
</span>
<span class="image-link">
<span
style="margin: 0 0 20px 0; display: inline-block; vertical-align: middle; width: 100%;"
>
<a
target="_blank"
href="https://pikwizard.com/photo/dynamic-multicolored-waveform-graph-on-digital-dashboard/b4f645ad32c0e9c94d33f2572eb9d394/"
style="text-decoration: none; font-size: 10px; margin: 0;"
>
<img src="https://pikwizard.com/pw/medium/b4f645ad32c0e9c94d33f2572eb9d394.jpg" style="margin: 0; width: 100%;" alt="" />
<p style="font-size: 12px; margin: 0;">PikWizard</p>
</a>
</span>
</span>
Free (free of charge)
Free for personal and commercial use.
Author: Authentic Images
Similar Free Stock Images

Premium


Premium


Premium

Premium


Premium


Premium


Premium


Premium

Premium


Premium


Premium


Premium


Premium


Premium

Premium

Premium


Premium


Premium


Premium


Premium


Premium


Premium


Premium


Premium


Premium

Explore More Free Stock Images