- Home >
- Stock Photos >
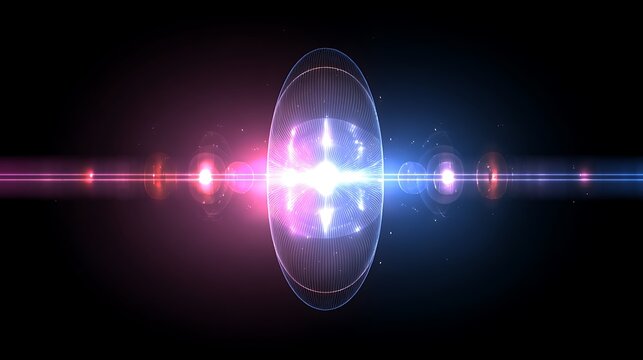
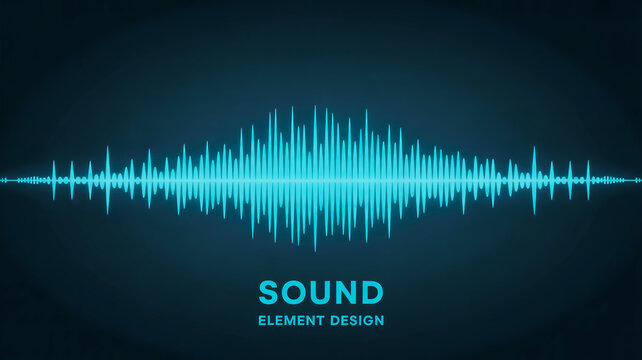
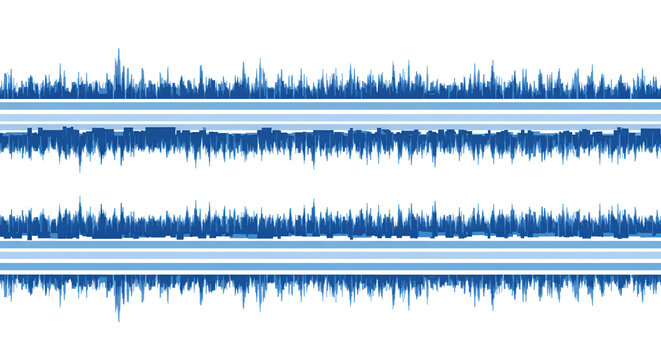
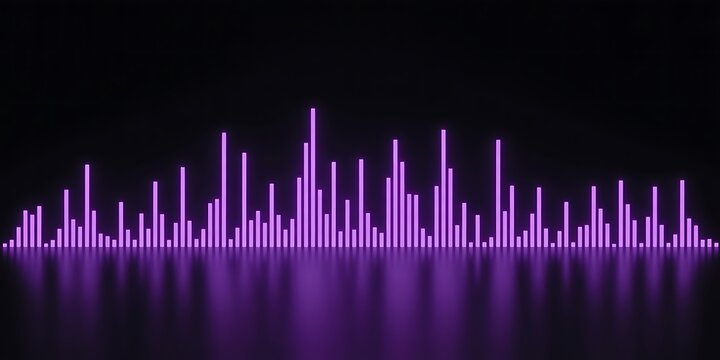
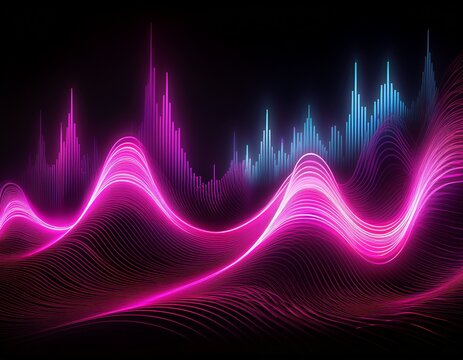
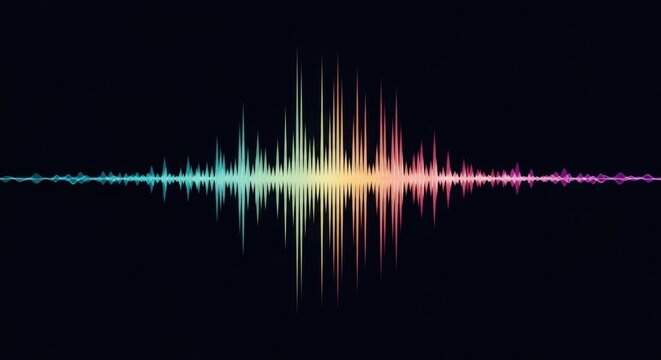
- Dynamic Music Equalizer with Blue Sound Waves on Black Background
Dynamic Music Equalizer with Blue Sound Waves on Black Background Image

Vibrant display of music equalizer and sound waves perfectly illustrates audio and technology themes. Ideal for use in digital design projects related to music software, technology platforms, or creating visuals for electronic music apps. Enhances presentations or marketing materials by adding tech-savvy appeal and a futuristic vibe.
Powered by 


3
downloads
downloads
Tags:
More
Credit Photo
If you would like to credit the Photo, here are some ways you can do so
Text Link
photo Link
<span class="text-link">
<span>
<a target="_blank" href=https://pikwizard.com/photo/dynamic-music-equalizer-with-blue-sound-waves-on-black-background/3d37c6664afd9a8610b1019ed462b8b6/>PikWizard</a>
</span>
</span>
<span class="image-link">
<span
style="margin: 0 0 20px 0; display: inline-block; vertical-align: middle; width: 100%;"
>
<a
target="_blank"
href="https://pikwizard.com/photo/dynamic-music-equalizer-with-blue-sound-waves-on-black-background/3d37c6664afd9a8610b1019ed462b8b6/"
style="text-decoration: none; font-size: 10px; margin: 0;"
>
<img src="https://pikwizard.com/pw/medium/3d37c6664afd9a8610b1019ed462b8b6.jpg" style="margin: 0; width: 100%;" alt="" />
<p style="font-size: 12px; margin: 0;">PikWizard</p>
</a>
</span>
</span>
Free (free of charge)
Free for personal and commercial use.
Author: Creative Art
Similar Free Stock Images

Premium


Premium


Premium


Premium


Premium


Premium


Premium


Premium


Premium


Premium


Premium


Premium


Premium


Premium


Premium


Premium


Premium


Premium


Premium


Premium


Premium


Premium


Premium


Premium