1. Home > 
  2. Stock Photos > 
  3. Dynamic Neon Circular Patterns with Randomized Data Visualization Elements

Dynamic Neon Circular Patterns with Randomized Data Visualization Elements Image

Dynamic Neon Circular Patterns with Randomized Data Visualization Elements

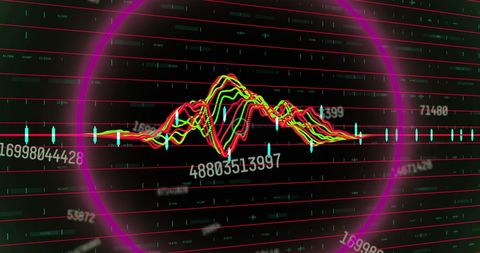
Colorful neon circular patterns crossing over digital data streams create a futuristic business and technology atmosphere. Ideal for use in financial analysis, tech branding, or presentations on digital media. Highly visual spots complement abstract and modern designs in settings that explore futuristic interface elements.

Powered by Shutterstock logo - Get 15% off with code: PIKWIZARD15
Image of neon shapes over data processing on black background. global technology, social media and digital interface concept digitally generated image. - Powered by Shutterstock - Get 15% off with code: PIKWIZARD15Displaying data dashboard on dark screen, with world map, pie charts, metrics and bar chart overlay. Technology, analytics, visualization, neon, interface, enterprise, innovation - Powered by Shutterstock - Get 15% off with code: PIKWIZARD15Image of rotating green and red squares, shapes and green scanner beams on black background. Connection, data, ai, processing, digital interface and communication, digitally generated image. - Powered by Shutterstock - Get 15% off with code: PIKWIZARD15Image of neon shapes and data over cityscape. Data processing, digital interface and technology concept digitally generated image. - Powered by Shutterstock - Get 15% off with code: PIKWIZARD15Image of rotating shapes and pink and blue hexagons with pink scanner beams on black background. Connection, data, processing, digital interface and communication, digitally generated image. - Powered by Shutterstock - Get 15% off with code: PIKWIZARD15

Credit Photo

If you would like to credit the Photo, here are some ways you can do so

Free (free of charge)

Free for personal and commercial use.

Author: Awesome Content

Similar Free Stock Images

Futuristic Data Analysis Overlaying Cityscape Digital Interface
Premium
Displaying neon concentric rings floating in futuristic digital interface, numeric overlays visible. Abstract, technology, innovation, data visualization, cyber, futuristic, digital art
Dynamic Multicolored Waveforms in Digital Data Visualization
Premium
Displaying dashboard showing neon hexagon outlines over code columns, with device-icon overlays. Cybersecurity, dataanalysis, digitalart, futuristic, technology, innovation, infographics
Premium
Displaying SALE banner hovering over neon hexagon shapes in futuristic UI, with world map grid. Futuristic, digital, technology, data, visualization, abstract, vibrant
Graphical Data Analysis on Digital Interface
Abstract Financial Data Streaming Over World Map Visualization
Digital Earth with Global Business Data Analysis Interface
Neon Circular Patterns with Dynamic Data Interface
Digital Interface with Data Processing and Security Elements
Dynamic Financial Graphs Illustrating Market Trends and Data
Digital Network Connections and Financial Data Analysis
Premium
Image of mathematical equations and data processing on screens over computer servers. Global computing and data processing concept digitally generated image.
Digital Graphs and Interfaces Representing Data Analysis on Green Background
Abstract Data Analysis Overlay on Coastal Landscape
Digital Financial Data Analysis on Abstract Background
Global Financial Data Interface with Uptrending Arrow
Premium
 touching global network and data customer connection
Data Visualization on Digital Grid with Technological Interface
Futuristic Data Visualization Oscillation Concept
Futuristic Digital Data Graphs and World Map
Premium
Composition of data processing over shapes on blue background. Global technology, computing and digital interface concept digitally generated image.
Complex Financial Data Visualizing in Digital Interface
Dynamic Financial Data Displayed on Neon Graphs
Dynamic Stock Market Graphs with Finance Data
Digital Data Processing on Interconnected Network
Premium
Image of spiral pattern, graphs, changing numbers, loading circles and bars on black background. Digitally generated, hologram, illustration, illuminated, report, progress, growth and business.
Colorful Digital Waveform with Analytical Overlay and Red Grid Lines
Dynamic Analysis of Stock Market Trends and Patterns
Financial Data Analysis with Growth Trend Arrows on Digital Interface
Dynamic Data Analysis over Virtual Grid with Neural Patterns
Premium
Displaying glowing nodes and connecting lines forming translucent polygons in dark interface. Abstract, technology, digital, network, futuristic, data visualization, geometric
Data Trends Overlayed on Cityscape Skyscrapers
Abstract Network Connections with Financial Data Overlay
Analytics Concept with Data Visualization and Green Overlay
Abstract Digital Globe with Neon Circular Patterns and Data Elements
Dynamic Stock Market Graph with Vibrant Color Lines on Grid
Abstract Stock Market Graph with Digital Data Animation
Premium
Displaying neon line chart rising over world map silhouette on UI with drifting shapes, data points. Futuristic, technology, data visualization, digital, infographic, abstract, geometrics
Premium
Displaying network graph with glowing pink nodes and neon lines in digital mesh, with floating code. Futuristic, cyber, technology, digital, abstract, neon, connectivity
Premium
Displaying digital dashboard on dark grid background with line graph, gauges, financial index table. Technology, analytics, futuristic, interface, dashboard, innovation, visualization
Premium
interface map on monitor, closeup
Innovative Digital Analysis Waveform with Futuristic Interface
Dynamic Financial Data Over Abstract Background
Abstract Financial Graphs with Rising Trends and Positive Indicators
Financial Graph Overlay on Global Digital Interface
Premium
Big data visualization. Network connection structure
Colorful Stock Market Graph with Data on Grid
Dynamic Digital Data Display with Vibrant Graphs
Abstract Financial Data Streams Over Cityscape Background
Dynamic Multicolored Graphs on Abstract Digital Finance Background
Premium
Abstract shapes and neon barcode against woman wearing vr headset. image game interface and entertainment technology concept
Complex Digital Financial Data on Grid
Data Visualization on Blue Digital Interface
Neon Binary Waveform Dashboard Visualizing Real-Time Data Stream and Signal Patterns
Digital Finance Analysis: Interactive Data Visualization on Screen
Premium
Image of mathematical equations and data processing over server room. Global technology, computing and digital interface concept digitally generated image.
Financial Data Analysis with Abstract Chart Grid Overlay
Animated Waveform and Icons on Digital Interface for Analytics
Dynamic Financial Data Charts in Modern Office Background
Interactive Financial Data Analysis with Digital Technology
Premium
Image of interface with data processing, digital wave against green gradient background. Computer interface and business technology concept
Dynamic Stock Market Graph Display on Digital Grid
Soundwave Visualization and Data Analysis on Digital Grid
Financial Data Graph with Digital Elements and Growth Indicators
Premium
Image of rotating shapes and green scanner beams on dark background. Connection, data, processing, business, digital interface and communication, digitally generated image.
Dynamic Financial Data Streams for Market Analysis
Dynamic Graphs Showing Stock Market Trends
Financial Data and Network Connections Over Black Background
Digital Financial Data Illustration with Neon Graphs and Nodes
Dynamic Stock Market Concept with Colorful Line Graphs
Glowing Data Graph Overlay on Spinning Black Globe
Dynamic Data and Graphs on Digital Screen
Futuristic Digital Financial Graphs with Energy Icon
Digital Data Waveform on High-Tech Interface
Rising Stock Market Trend with Digital Data Analytics
Digital Financial Data Visualization on Grid Display
Global Stock Market Analysis with Digital Interface Over World Map
Dynamic Stock Market Data Analysis on Blue Grid Background
Premium
Image of interfaces with green chart processing data over coloured light spots, on black. Connection, data, ai, processing, digital interface and communication, digitally generated image.
Futuristic Green Data Graph with Digital Interference Design
Illuminated Financial Data Chart Display on Dark Backdrop
Bangladesh Flag Merged with Financial Data for Global Market Concept
Colorful Financial Chart Representing Stock Market Trends
Abstract Robotic Arm Analyzing Digital Financial Graphs for AI-Based Trading
Premium
network interface digital in hand
Financial Data Visualization with Network of Connections
Abstract Financial Data with Digitally Enhanced Graphs
Global Data Processing on Digital Earth Background
Dynamic Financial Graph on Digital Background
Premium
Business users navigating field of light beams and puzzle-shaped connections visualizing data transmission. Concept of communication, network, business, technology. Composite collage
Abstract Digital Finance Graph Interface Display
Abstract Data Wave Patterns on Technology Interface
Global Stock Market Chart Over World Map
Dynamic Financial Data Analyzing with Graph Overlays
Futuristic Financial Graphs with Dynamic Green Line
Dynamic Data Visualisation with Futuristic Digital Display
Dynamic Data Graph on Dark Digital Grid Background
Dynamic Stock Market Analysis with Trend Lines
Dynamic Stock Market Data Visualization on Digital Screen
Global Data Analytics and Stock Market Visual Interface
Abstract Financial Data Visualization with Multicolored Graphs
Digital Financial Data Analytics on Modern Display
Colorful Stock Market Graph on Dark Grid Background Illustrating Global Economy Trends
Futuristic Neon Waveform on Digital Screen
Premium
pressing document icon over computer binary code
Dynamic Digital Market Analysis with Holographic Data
Premium
This captivating digital illustration features a futuristic interface with hands interacting, showcasing data analysis and technology visualization in a dark environment.
Dynamic Data Processing with Digital Interfaces in Motion
Global Data Analysis with World Map and Pulse Wave
Dynamic Neon Lines with Data Streams Over Digital Grid
Abstract Financial Data Interface with Dynamic Chart Lines
Premium
Image of rotating shapes over text data files processing on black background. Connection, data, processing, digital interface and communication, digitally generated image.
Digital Data Processing and Global Connectivity Illustrated
Global Data Projection Showing Stock Market Trends with Digital Globe
Inflation Analytics: Graphic Representation of Stock Market Trends
Holographic Battery Icon Over Stock Market Trading Board
Premium
Image of scope scanning with data processing on blue background. Global technology, computing and digital interface concept digitally generated image.
Global Financial Technology Network and Data Analytics
Digital Data Processing with Futuristic Graphs and Interface
Abstract Digital Data Processing with Visual Firewall Concept
Dynamic Green Stock Chart on Digital Grid Background
Premium
Businessman holding technology icon concept
Dynamic Stock Market Graph on Digital Interface
Global Financial Data with Dynamic Analytics Visualization
Explore More Free Stock Images