
- Home >
- Stock Photos >
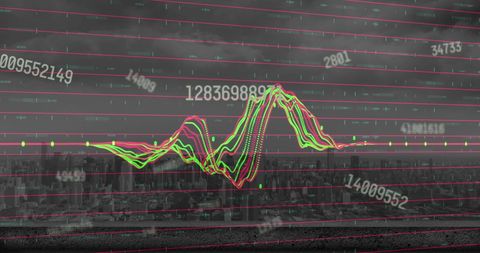
- Dynamic Neon Lines with Data Streams Over Digital Grid
Dynamic Neon Lines with Data Streams Over Digital Grid Image

Vibrant neon lines move dynamically over a digital grid filled with numbers and data, suggesting trend analysis in a technological context. Suitable for illustrating concepts related to data visualization, financial analysis, business technology, or digital interfaces in presentations and marketing materials.
Powered by  - Get 15% off with code: PIKWIZARD15


downloads
Tags:
More
Credit Photo
If you would like to credit the Photo, here are some ways you can do so
Text Link
photo Link
<span class="text-link">
<span>
<a target="_blank" href=https://pikwizard.com/photo/dynamic-neon-lines-with-data-streams-over-digital-grid/88dda45d1763e729f83aa030a3be26e8/>PikWizard</a>
</span>
</span>
<span class="image-link">
<span
style="margin: 0 0 20px 0; display: inline-block; vertical-align: middle; width: 100%;"
>
<a
target="_blank"
href="https://pikwizard.com/photo/dynamic-neon-lines-with-data-streams-over-digital-grid/88dda45d1763e729f83aa030a3be26e8/"
style="text-decoration: none; font-size: 10px; margin: 0;"
>
<img src="https://pikwizard.com/pw/medium/88dda45d1763e729f83aa030a3be26e8.jpg" style="margin: 0; width: 100%;" alt="" />
<p style="font-size: 12px; margin: 0;">PikWizard</p>
</a>
</span>
</span>
Free (free of charge)
Free for personal and commercial use.
Author: Awesome Content
Similar Free Stock Images

Premium


Premium

Premium


Premium


Premium


Premium


Premium


Premium

Premium


Premium

Premium
Premium


Premium


Premium


Premium


Premium


Premium


Premium


Premium


Premium


Premium


Premium

Premium


Premium


Premium


Explore More Free Stock Images