
- Home >
- Free Stock Photos & Images >
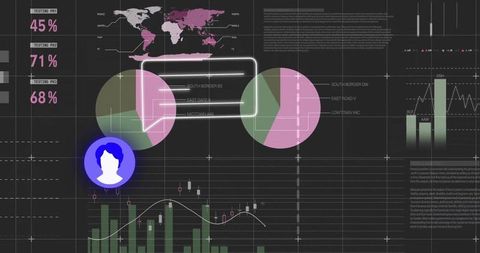
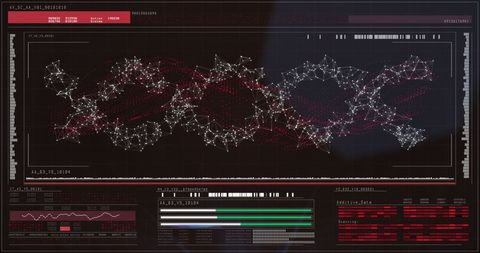
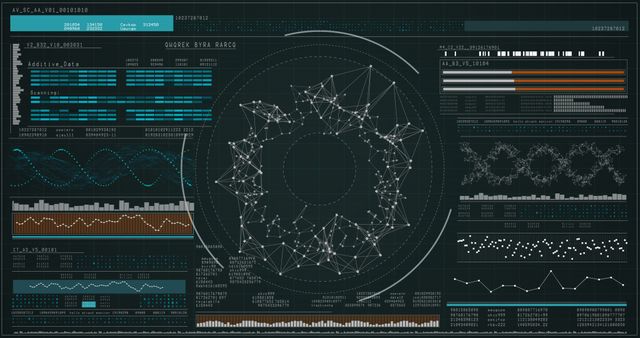
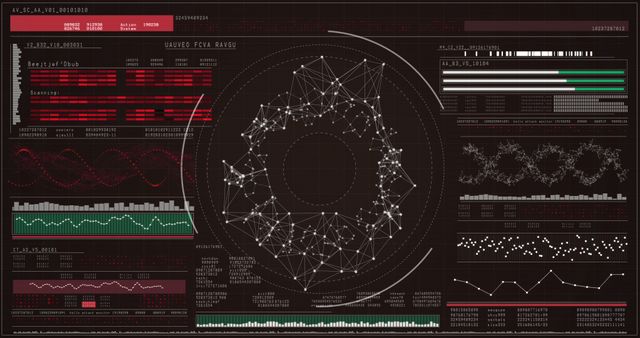
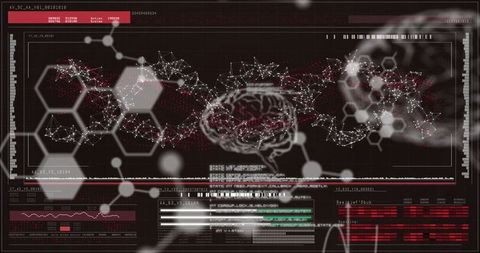
- Dynamic Network Data Dashboard Visualizing Pulsing Node Graph, Hex Overlays and Metrics
Dynamic Network Data Dashboard Visualizing Pulsing Node Graph, Hex Overlays and Metrics Free Stock Image
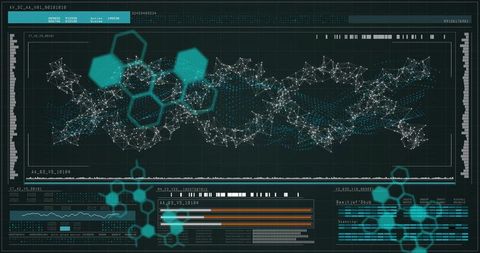
Dark analytics dashboard featuring central pulsing network graph made of interconnected nodes and edges, overlaid with translucent teal hexagons and horizontal metric bars. Wireframe nodes glowing, point cloud streams flowing, metric bars updating, grid lines providing technical context. Suitable for illustrating network analysis, real-time monitoring, cybersecurity dashboards, AI and machine learning visualizations, biotech data exploration, big data analytics. Usage ideas include hero banner for tech websites, header for data science or cybersecurity blog posts, slide deck background for executive presentations, cover for research reports, marketing visuals for SaaS analytics platforms, UI mockups for monitoring tools. Design working well with overlay text or icons thanks to ample dark negative space around central graphic. Color palette offering teal accents and dark slate background, supporting high-contrast presentations and print. Ideal for branding, editorial, advertising, product pages, scientific publications.
Powered by  - Get 15% off with code: PIKWIZARD15


downloads
Tags:
More
Credit Photo
If you would like to credit the Photo, here are some ways you can do so
Text Link
photo Link
<span class="text-link">
<span>
<a target="_blank" href=https://pikwizard.com/photo/dynamic-network-data-dashboard-visualizing-pulsing-node-graph-hex-overlays-and-metrics/86b369970dfd86b4546152d2800d375f/>PikWizard</a>
</span>
</span>
<span class="image-link">
<span
style="margin: 0 0 20px 0; display: inline-block; vertical-align: middle; width: 100%;"
>
<a
target="_blank"
href="https://pikwizard.com/photo/dynamic-network-data-dashboard-visualizing-pulsing-node-graph-hex-overlays-and-metrics/86b369970dfd86b4546152d2800d375f/"
style="text-decoration: none; font-size: 10px; margin: 0;"
>
<img src="https://thumbs.wbm.im/pw/medium/86b369970dfd86b4546152d2800d375f.jpg" style="margin: 0; width: 100%;" alt="Dynamic Network Data Dashboard Visualizing Pulsing Node Graph, Hex Overlays and Metrics" />
<p style="font-size: 12px; margin: 0;">PikWizard</p>
</a>
</span>
</span>
Free (free of charge)
Free for personal and commercial use.
Author: Creative Art
Similar Free Stock Images


Premium


Premium


Premium


Premium


Premium


Premium


Premium


Premium


Premium


Premium


Premium


Premium


Premium


Premium


Premium


Premium


Premium


Premium


Premium


Premium


Premium


Premium


Premium


Premium


Premium

Explore More Free Stock Images