- Home >
- Stock Photos >
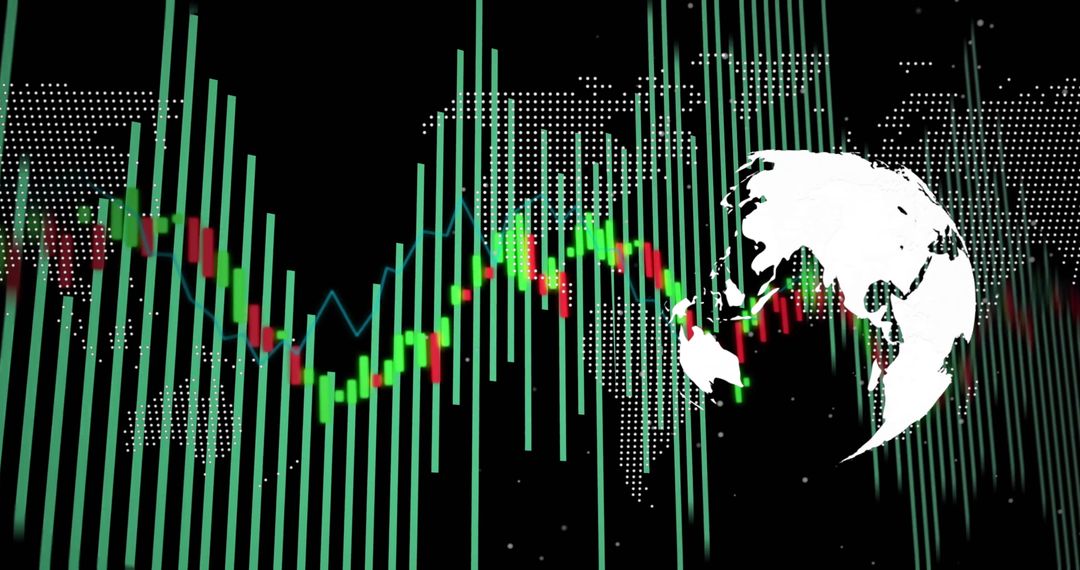
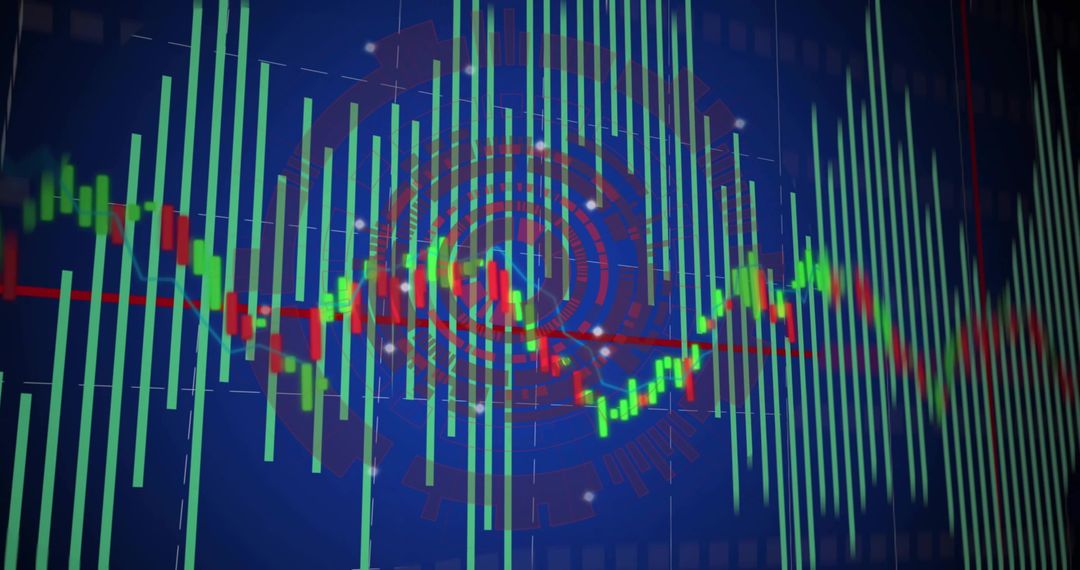
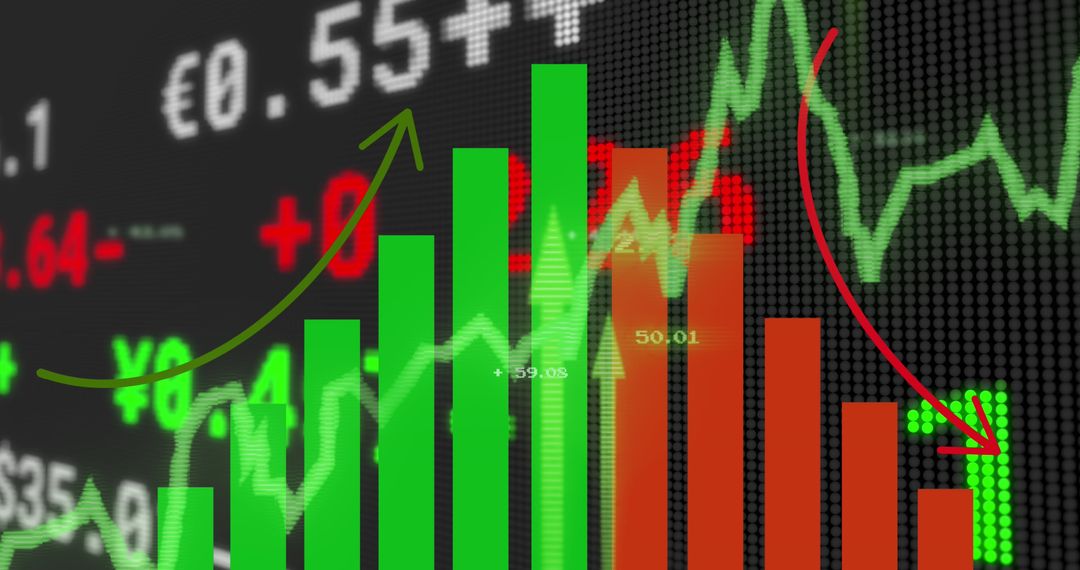
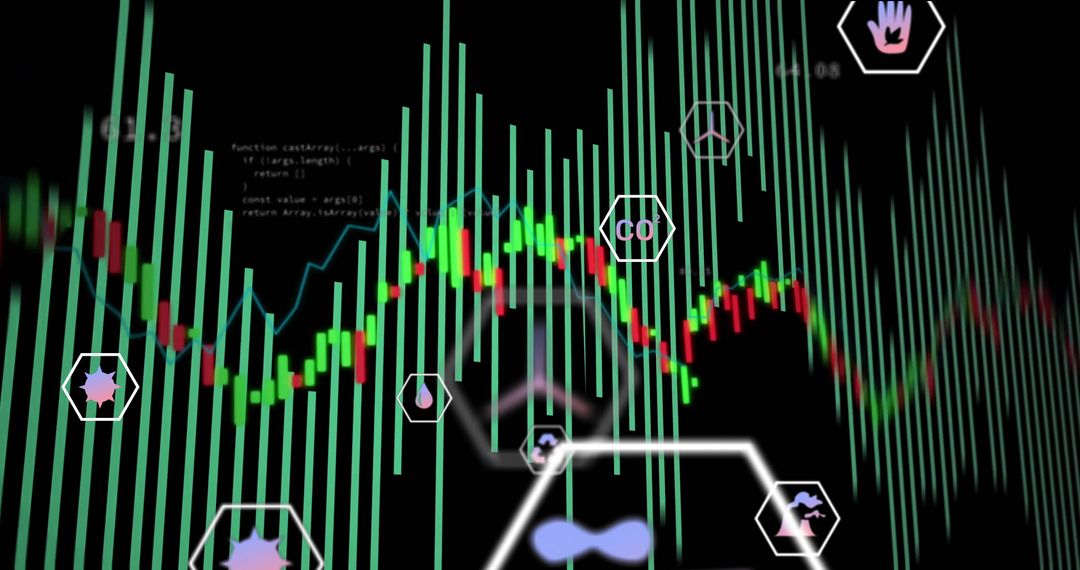
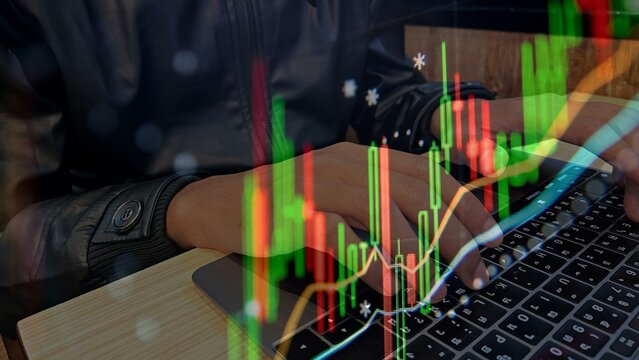
- Dynamic NFT Display with Digital Trading Finance Analytics
Dynamic NFT Display with Digital Trading Finance Analytics Image

Useful for conveying the concept of digital assets and financial trading, this image illustrates the intersection of finance and technology through NFTs. Perfect for articles, presentations, or projects discussing blockchain investment strategies, market analysis or cryptocurrency economics.
Powered by 


0
downloads
downloads
Tags:
More
Credit Photo
If you would like to credit the Photo, here are some ways you can do so
Text Link
photo Link
<span class="text-link">
<span>
<a target="_blank" href=https://pikwizard.com/photo/dynamic-nft-display-with-digital-trading-finance-analytics/fd00b0dabf568533ae2af7d48fa27ecc/>PikWizard</a>
</span>
</span>
<span class="image-link">
<span
style="margin: 0 0 20px 0; display: inline-block; vertical-align: middle; width: 100%;"
>
<a
target="_blank"
href="https://pikwizard.com/photo/dynamic-nft-display-with-digital-trading-finance-analytics/fd00b0dabf568533ae2af7d48fa27ecc/"
style="text-decoration: none; font-size: 10px; margin: 0;"
>
<img src="https://pikwizard.com/pw/medium/fd00b0dabf568533ae2af7d48fa27ecc.jpg" style="margin: 0; width: 100%;" alt="" />
<p style="font-size: 12px; margin: 0;">PikWizard</p>
</a>
</span>
</span>
Free (free of charge)
Free for personal and commercial use.
Author: Creative Art
Similar Free Stock Images

Premium


Premium


Premium


Premium


Premium


Premium


Premium


Premium


Premium


Premium


Premium


Premium


Premium


Premium


Premium


Premium


Premium