
- Home >
- Stock Photos >
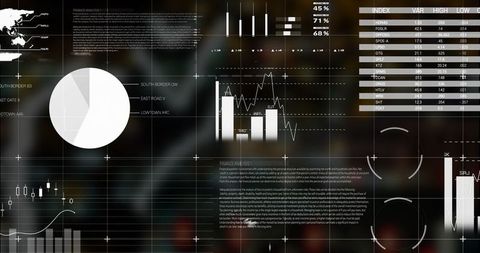
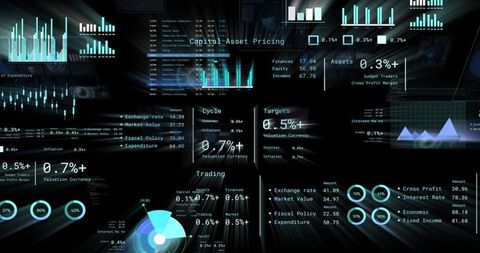
- Dynamic Numbers and Data with Futuristic Digital Interface
Dynamic Numbers and Data with Futuristic Digital Interface Image
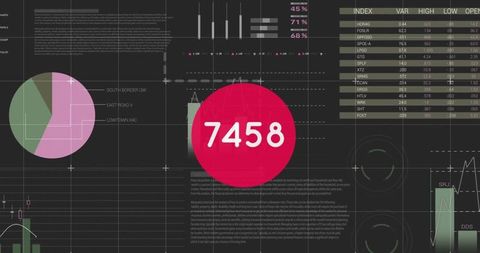
This depicts numbers in a dynamic format overlaid on charts and data visualizations, showcasing a digital interface theme. Ideal for use in tech, financial analytics, digital marketing concepts, or presentations focused on innovation and data analysis.
Powered by 


downloads
Tags:
More
Credit Photo
If you would like to credit the Photo, here are some ways you can do so
Text Link
photo Link
<span class="text-link">
<span>
<a target="_blank" href=https://pikwizard.com/photo/dynamic-numbers-and-data-with-futuristic-digital-interface/337baa96ce53fba2c5c1a5af6ea720a2/>PikWizard</a>
</span>
</span>
<span class="image-link">
<span
style="margin: 0 0 20px 0; display: inline-block; vertical-align: middle; width: 100%;"
>
<a
target="_blank"
href="https://pikwizard.com/photo/dynamic-numbers-and-data-with-futuristic-digital-interface/337baa96ce53fba2c5c1a5af6ea720a2/"
style="text-decoration: none; font-size: 10px; margin: 0;"
>
<img src="https://pikwizard.com/pw/medium/337baa96ce53fba2c5c1a5af6ea720a2.jpg" style="margin: 0; width: 100%;" alt="" />
<p style="font-size: 12px; margin: 0;">PikWizard</p>
</a>
</span>
</span>
Free (free of charge)
Free for personal and commercial use.
Author: Authentic Images
Similar Free Stock Images

Premium


Premium

Premium


Premium


Premium


Premium

Premium


Premium


Premium

Premium

Premium


Premium


Premium


Premium


Premium


Premium


Premium


Premium


Premium


Premium

Premium

Premium

Premium


Premium


Premium


Explore More Free Stock Images