
- Home >
- Stock Photos >
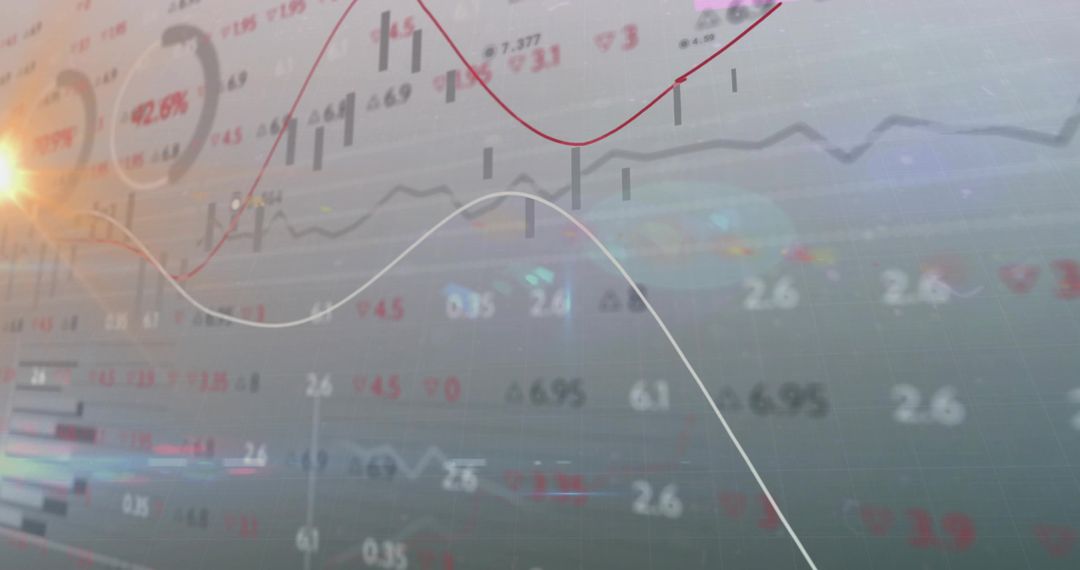
- Dynamic Numerical Display of Stock Market Trends
Dynamic Numerical Display of Stock Market Trends Image

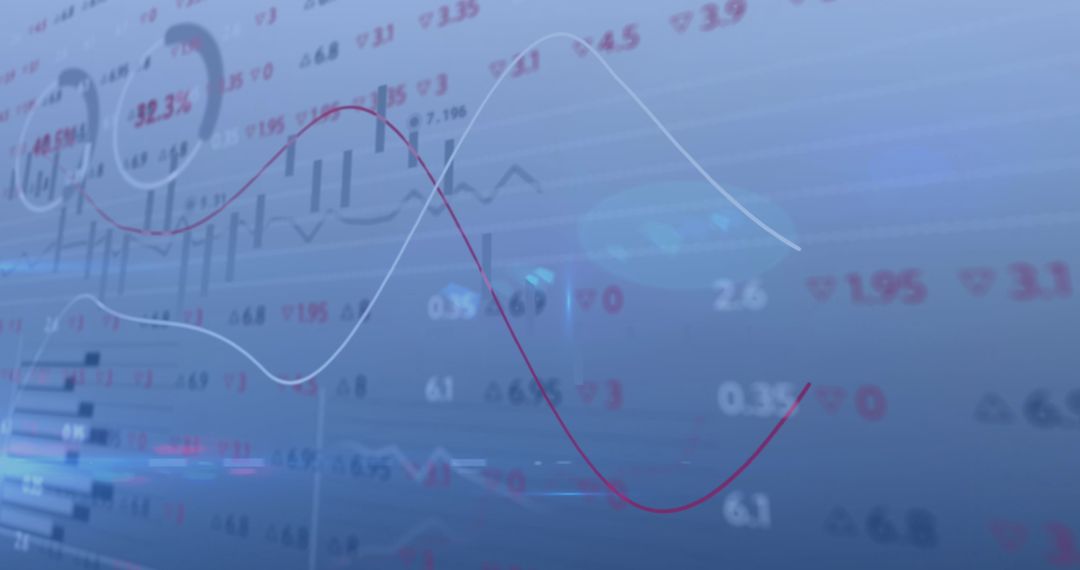
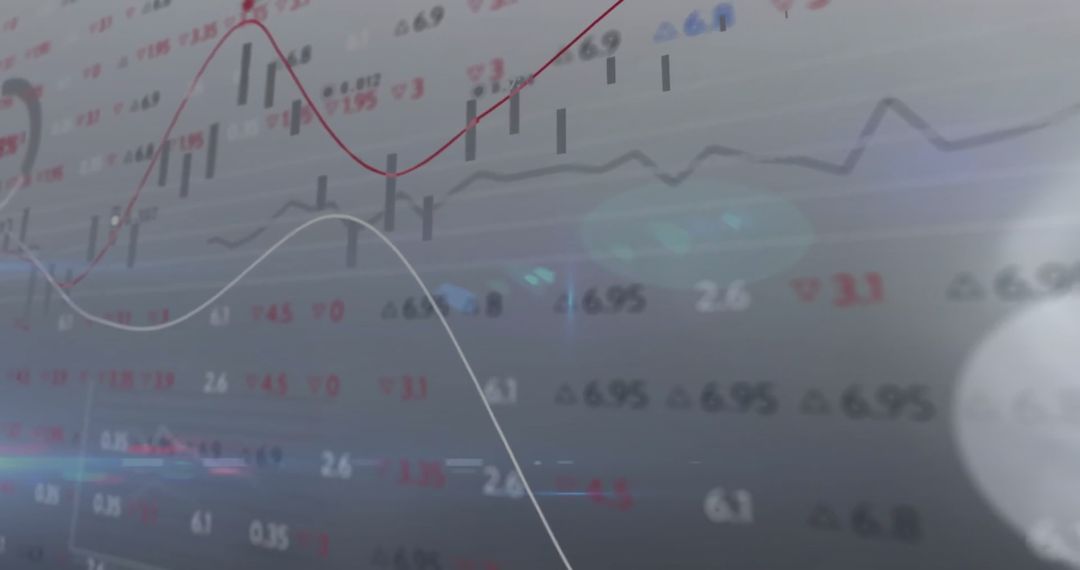
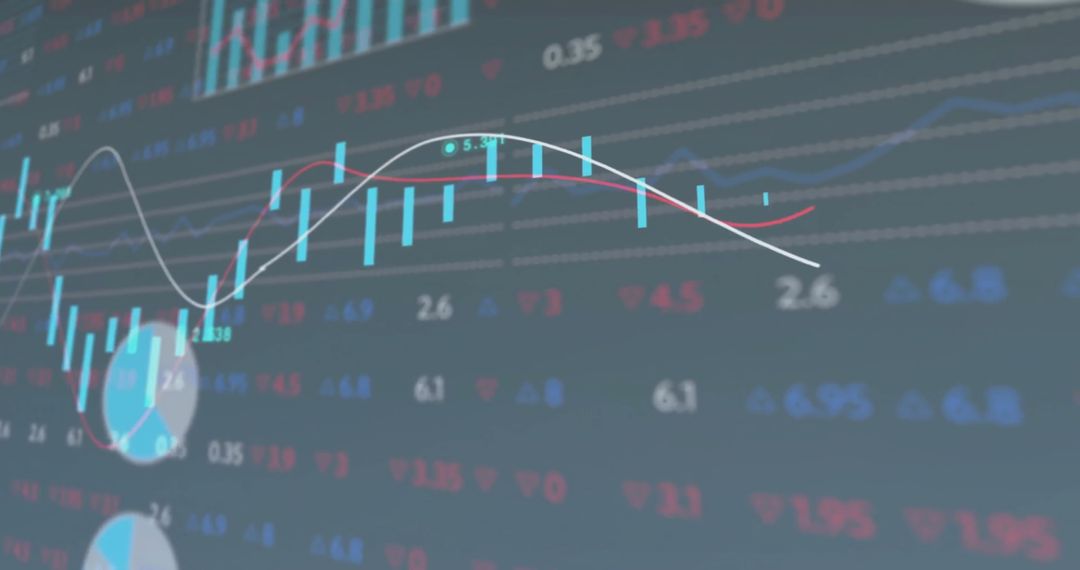
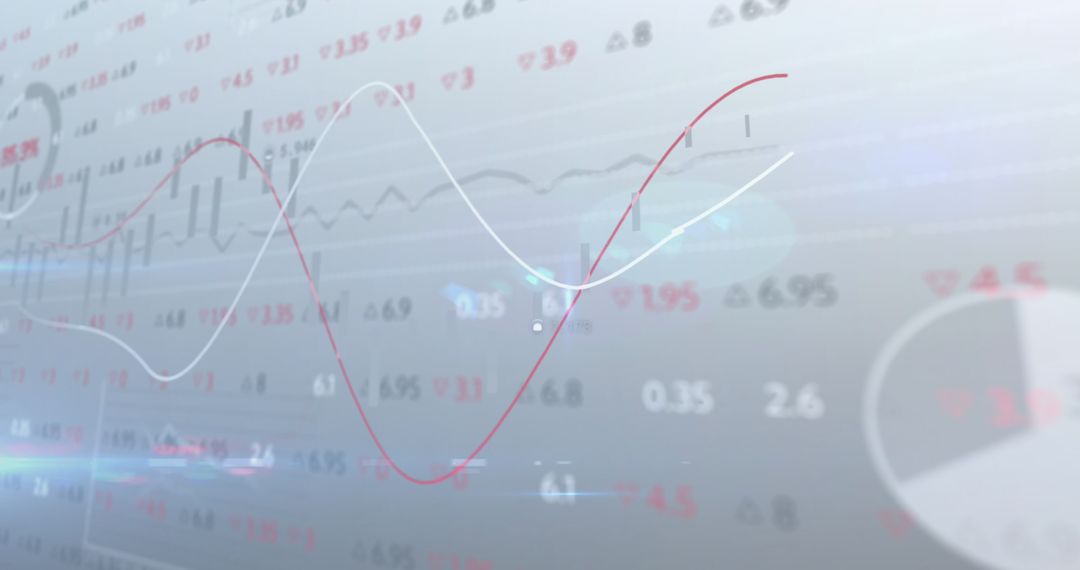
Complex grid displays moving numerical data and graphs showing stock market activities. Vibrant changes reflect dynamic nature of global finance. Ideal for conveying concepts like data analysis, financial forecasting, business intelligence, and market studies.
Powered by  - Get 15% off with code: PIKWIZARD15


10
downloads
downloads
Tags:
More
Credit Photo
If you would like to credit the Photo, here are some ways you can do so
Text Link
photo Link
<span class="text-link">
<span>
<a target="_blank" href=https://pikwizard.com/photo/dynamic-numerical-display-of-stock-market-trends/c255393dbaa0120e5e08cf216545d299/>PikWizard</a>
</span>
</span>
<span class="image-link">
<span
style="margin: 0 0 20px 0; display: inline-block; vertical-align: middle; width: 100%;"
>
<a
target="_blank"
href="https://pikwizard.com/photo/dynamic-numerical-display-of-stock-market-trends/c255393dbaa0120e5e08cf216545d299/"
style="text-decoration: none; font-size: 10px; margin: 0;"
>
<img src="https://pikwizard.com/pw/medium/c255393dbaa0120e5e08cf216545d299.jpg" style="margin: 0; width: 100%;" alt="" />
<p style="font-size: 12px; margin: 0;">PikWizard</p>
</a>
</span>
</span>
Free (free of charge)
Free for personal and commercial use.
Author: Authentic Images
Similar Free Stock Images

Premium


Premium


Premium


Premium


Premium


Premium


Premium


Premium


Premium


Premium


Premium


Premium


Premium


Premium


Premium


Premium


Premium


Premium


Premium


Premium


Premium


Premium


Premium


Premium

