- Home >
- Stock Photos >
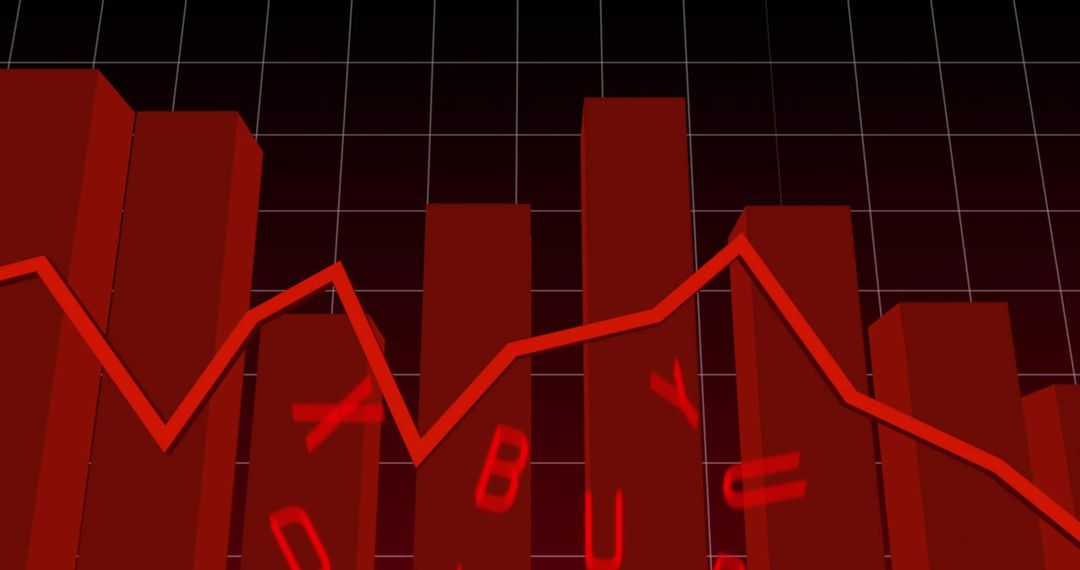
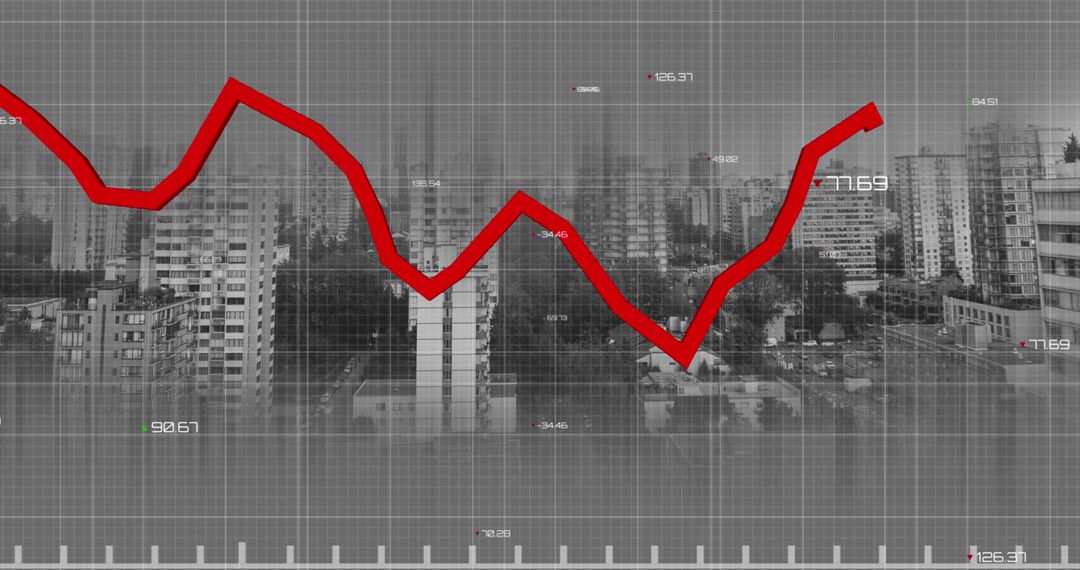
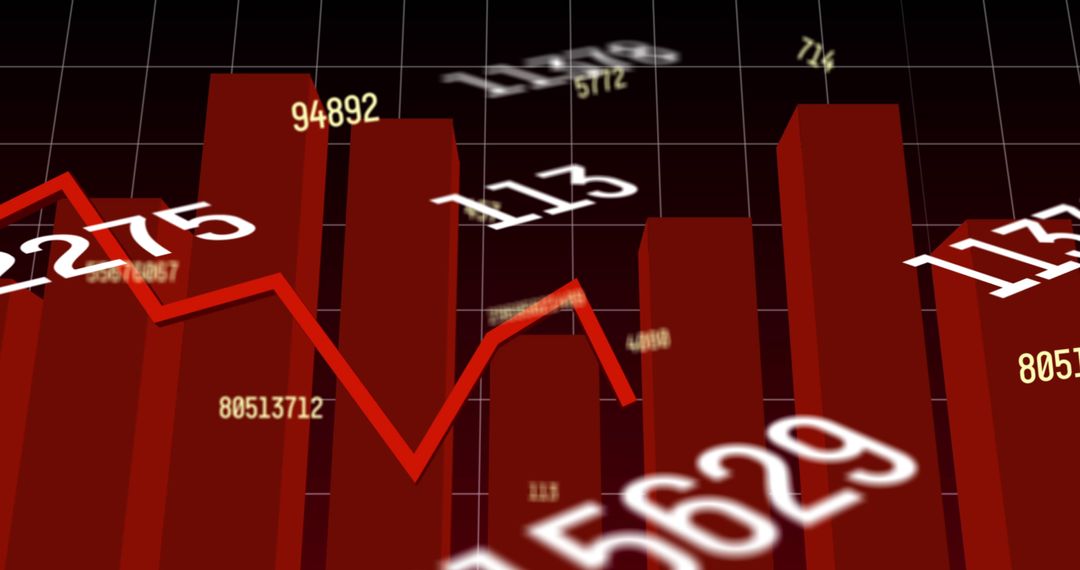
- Dynamic Red Chart Displaying Global Financial Trends
Dynamic Red Chart Displaying Global Financial Trends Image

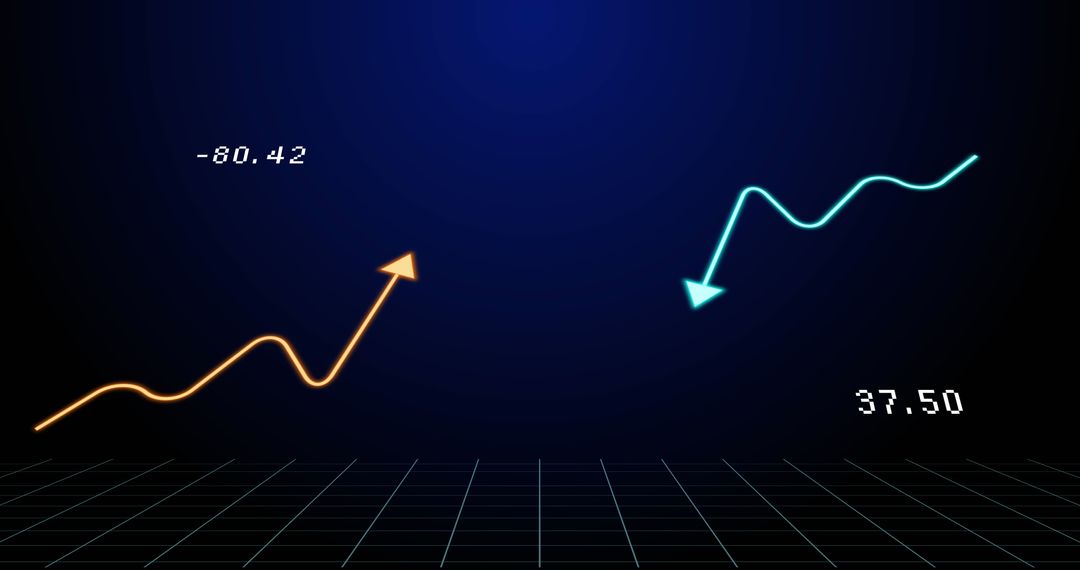
Complex financial concepts are often easier to grasp with visualizations like this one portraying fluctuating statistics. Suitable for illustrating financial reports or articles discussing global economic movements and market analysis. Perfect background for presentations focusing on data trends and financial strategies.
Powered by  - Get 15% off with code: PIKWIZARD15


2
downloads
downloads
Tags:
More
Credit Photo
If you would like to credit the Photo, here are some ways you can do so
Text Link
photo Link
<span class="text-link">
<span>
<a target="_blank" href=https://pikwizard.com/photo/dynamic-red-chart-displaying-global-financial-trends/f1dbdc84bd13a5422f41f68ee8c814b1/>PikWizard</a>
</span>
</span>
<span class="image-link">
<span
style="margin: 0 0 20px 0; display: inline-block; vertical-align: middle; width: 100%;"
>
<a
target="_blank"
href="https://pikwizard.com/photo/dynamic-red-chart-displaying-global-financial-trends/f1dbdc84bd13a5422f41f68ee8c814b1/"
style="text-decoration: none; font-size: 10px; margin: 0;"
>
<img src="https://pikwizard.com/pw/medium/f1dbdc84bd13a5422f41f68ee8c814b1.jpg" style="margin: 0; width: 100%;" alt="" />
<p style="font-size: 12px; margin: 0;">PikWizard</p>
</a>
</span>
</span>
Free (free of charge)
Free for personal and commercial use.
Author: People Creations
Similar Free Stock Images

Premium


Premium


Premium


Premium


Premium


Premium


Premium


Premium


Premium


Premium


Premium


Premium


Premium


Premium


Premium


Premium


Premium


Premium


Premium


Premium


Premium


Premium


Premium


Premium