- Home >
- Stock Photos >
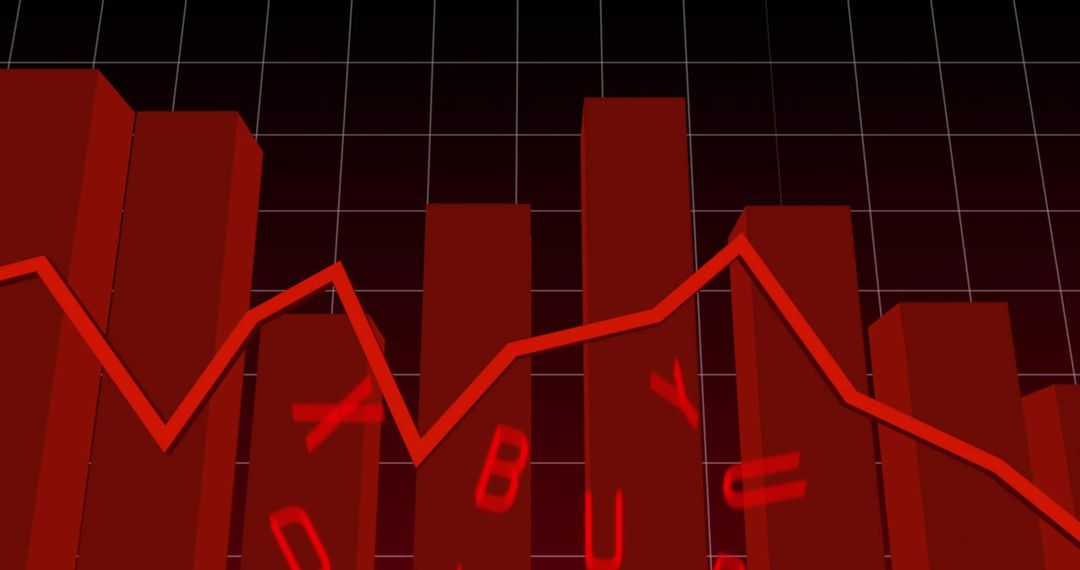
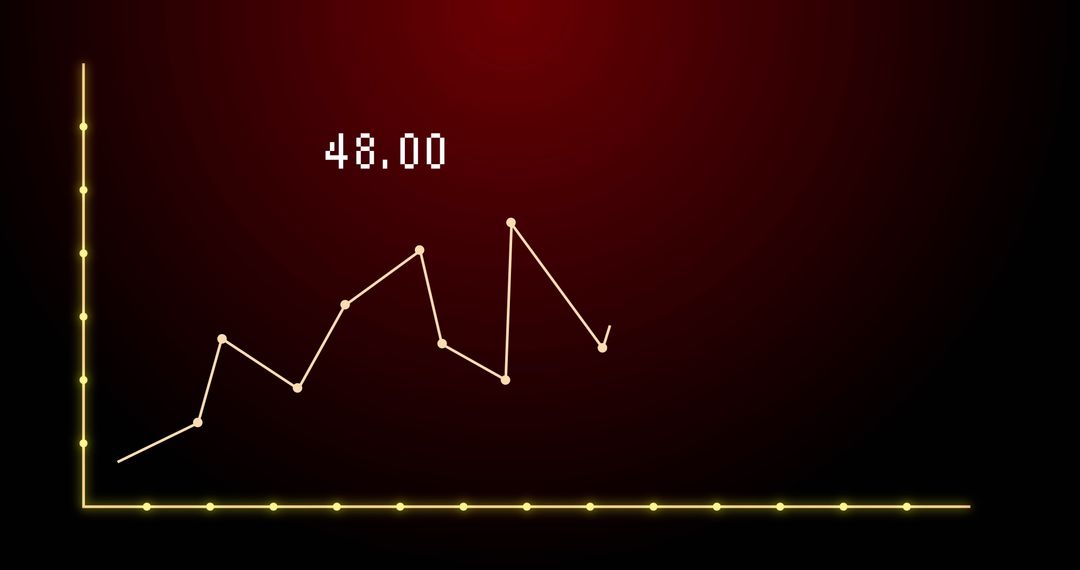
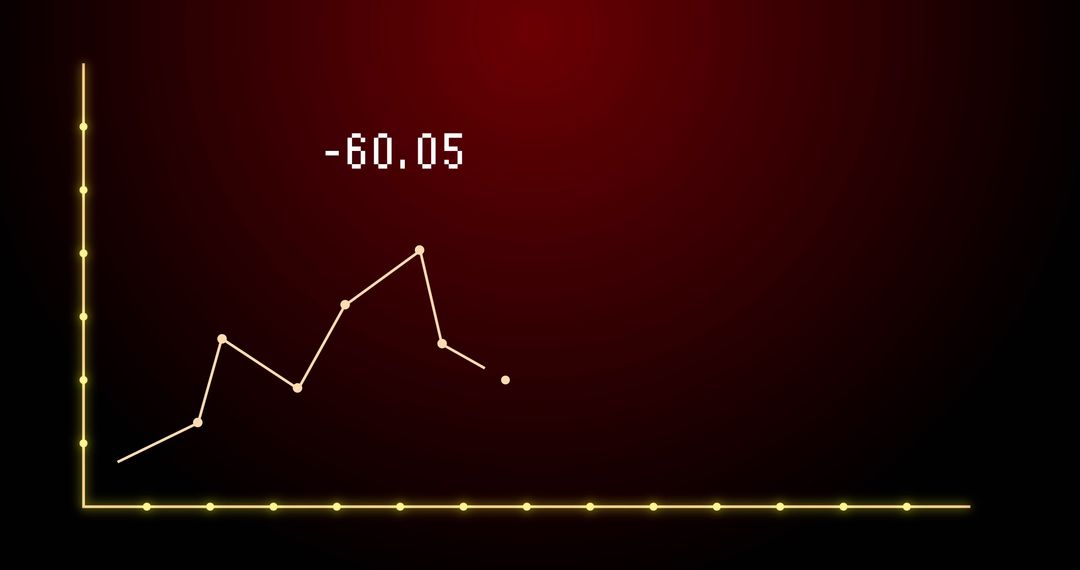
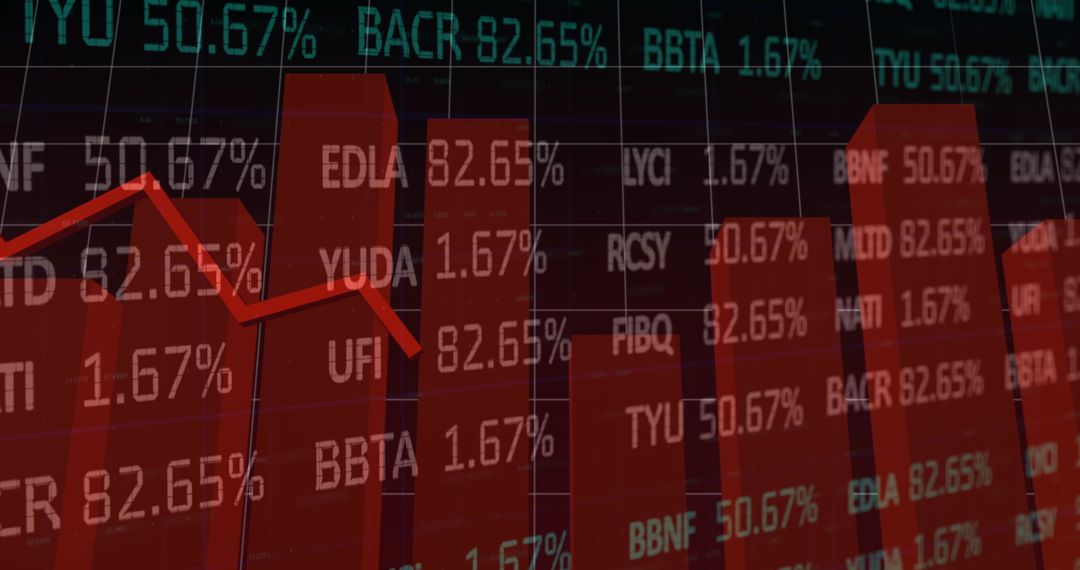
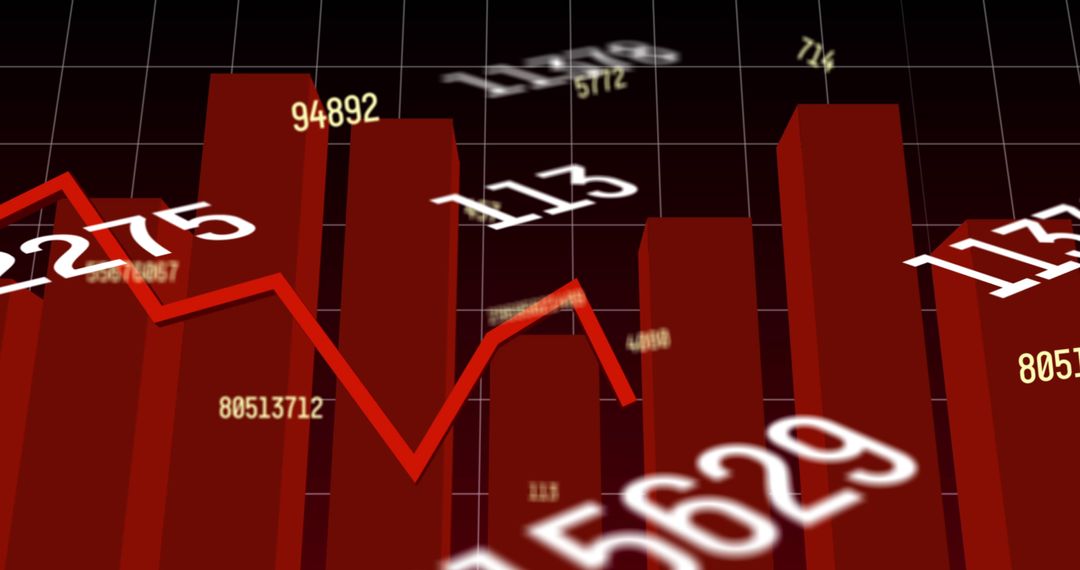
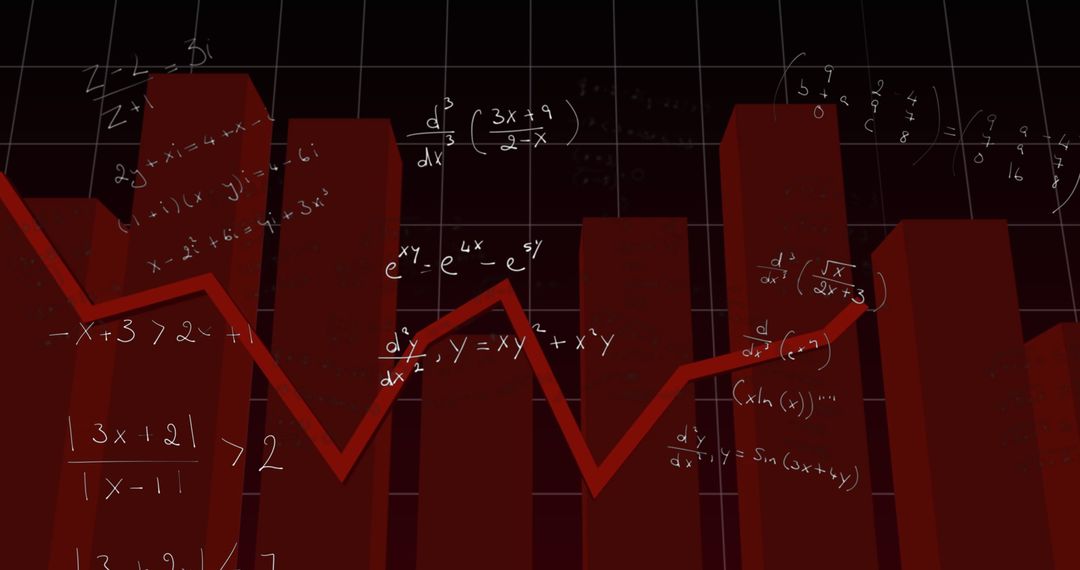
- Dynamic Red Financial Graph Indicating Market Fluctuations
Dynamic Red Financial Graph Indicating Market Fluctuations Image

Vibrant illustration depicting dramatic shifts in economic indicators using red bars against a grid background. Pertinent for illustrating financial reports, market analysis explanations, economic studies or data trend presentations in professional settings.
Powered by  - Get 15% off with code: PIKWIZARD15


2
downloads
downloads
Tags:
More
Credit Photo
If you would like to credit the Photo, here are some ways you can do so
Text Link
photo Link
<span class="text-link">
<span>
<a target="_blank" href=https://pikwizard.com/photo/dynamic-red-financial-graph-indicating-market-fluctuations/0d0b63ec57fef10494e13a80b7ef7ebc/>PikWizard</a>
</span>
</span>
<span class="image-link">
<span
style="margin: 0 0 20px 0; display: inline-block; vertical-align: middle; width: 100%;"
>
<a
target="_blank"
href="https://pikwizard.com/photo/dynamic-red-financial-graph-indicating-market-fluctuations/0d0b63ec57fef10494e13a80b7ef7ebc/"
style="text-decoration: none; font-size: 10px; margin: 0;"
>
<img src="https://pikwizard.com/pw/medium/0d0b63ec57fef10494e13a80b7ef7ebc.jpg" style="margin: 0; width: 100%;" alt="" />
<p style="font-size: 12px; margin: 0;">PikWizard</p>
</a>
</span>
</span>
Free (free of charge)
Free for personal and commercial use.
Author: Creative Art
Similar Free Stock Images

Premium


Premium


Premium


Premium


Premium


Premium


Premium


Premium


Premium


Premium


Premium


Premium


Premium


Premium


Premium


Premium


Premium


Premium


Premium


Premium


Premium


Premium


Premium


Premium