- Home >
- Stock Photos >
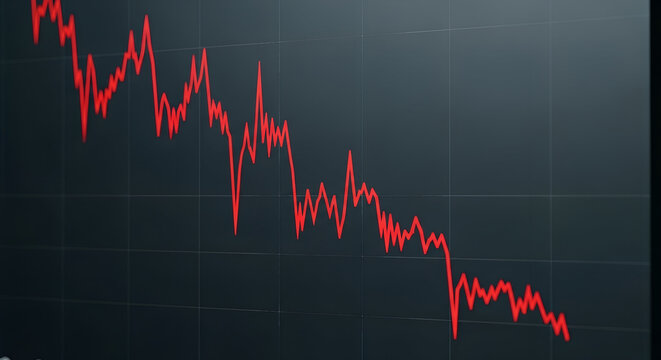
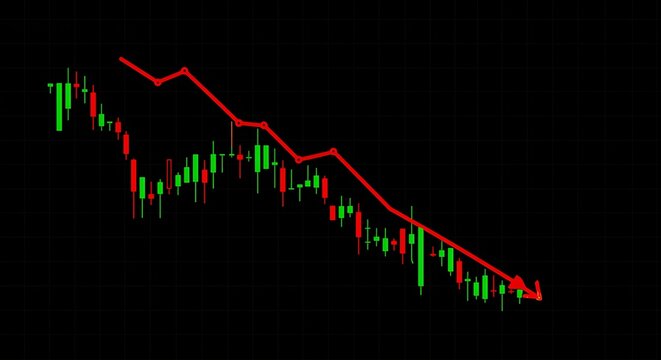
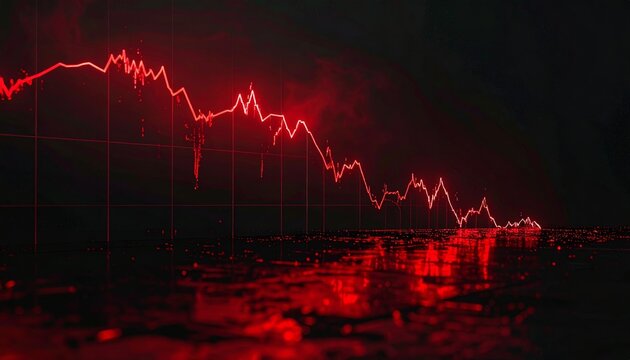
- Dynamic Red Line Graph on Dark Background Depicting Financial Crisis
Dynamic Red Line Graph on Dark Background Depicting Financial Crisis Image

Red line graph sharply falling against a dark, digital grid backdrop is perfect for illustrating financial challenges or market downturns. Ideal for use in websites, articles, and presentations focusing on economic collapse, stock market analysis, or business struggles. Highlights pessimistic financial conditions.
Powered by 


2
downloads
downloads
Tags:
More
Credit Photo
If you would like to credit the Photo, here are some ways you can do so
Text Link
photo Link
<span class="text-link">
<span>
<a target="_blank" href=https://pikwizard.com/photo/dynamic-red-line-graph-on-dark-background-depicting-financial-crisis/b40e519daf3df77ad22d9467b427988b/>PikWizard</a>
</span>
</span>
<span class="image-link">
<span
style="margin: 0 0 20px 0; display: inline-block; vertical-align: middle; width: 100%;"
>
<a
target="_blank"
href="https://pikwizard.com/photo/dynamic-red-line-graph-on-dark-background-depicting-financial-crisis/b40e519daf3df77ad22d9467b427988b/"
style="text-decoration: none; font-size: 10px; margin: 0;"
>
<img src="https://pikwizard.com/pw/medium/b40e519daf3df77ad22d9467b427988b.jpg" style="margin: 0; width: 100%;" alt="" />
<p style="font-size: 12px; margin: 0;">PikWizard</p>
</a>
</span>
</span>
Free (free of charge)
Free for personal and commercial use.
Author: Authentic Images
Similar Free Stock Images

Premium


Premium


Premium


Premium


Premium


Premium


Premium


Premium


Premium


Premium


Premium


Premium


Premium


Premium


Premium


Premium


Premium


Premium


Premium


Premium


Premium


Premium


Premium


Premium