
- Home >
- Stock Photos >
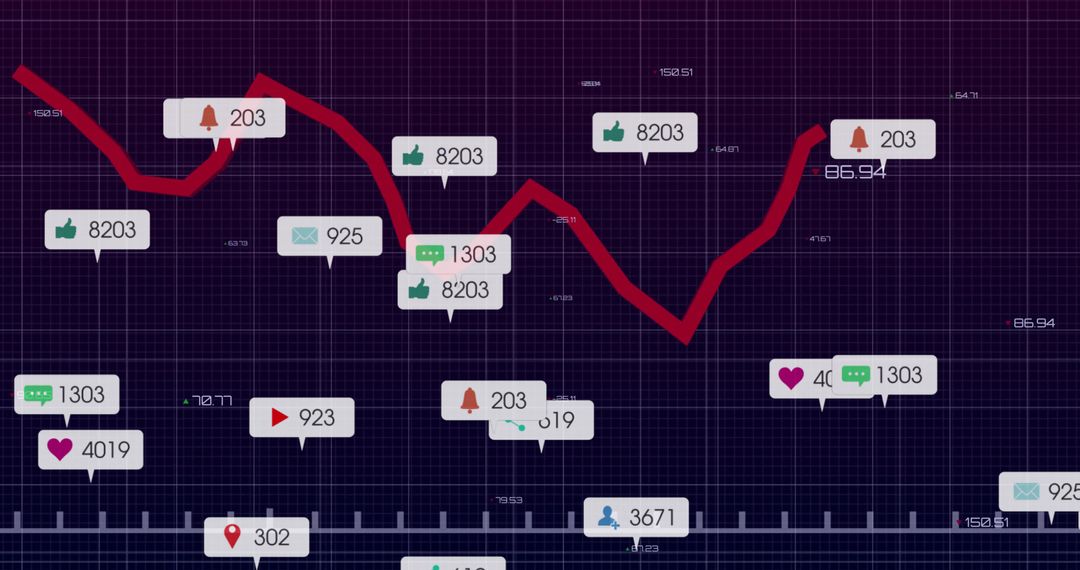
- Dynamic Red Line Showing Business Analytics Insights
Dynamic Red Line Showing Business Analytics Insights Image

Depicts a red line dropping across a grid, symbolizing financial decline or performance analysis. Suitable for content relating to corporate finance, data analytics, business forecasting, or statistical insights. Ideal for blog articles, financial reports, or educational materials seeding topics in current economic influences or stock trending technologies.
Powered by  - Get 15% off with code: PIKWIZARD15


0
downloads
downloads
Tags:
More
Credit Photo
If you would like to credit the Photo, here are some ways you can do so
Text Link
photo Link
<span class="text-link">
<span>
<a target="_blank" href=https://pikwizard.com/photo/dynamic-red-line-showing-business-analytics-insights/d92b0bcd994fd7a8c318a418d48862b4/>PikWizard</a>
</span>
</span>
<span class="image-link">
<span
style="margin: 0 0 20px 0; display: inline-block; vertical-align: middle; width: 100%;"
>
<a
target="_blank"
href="https://pikwizard.com/photo/dynamic-red-line-showing-business-analytics-insights/d92b0bcd994fd7a8c318a418d48862b4/"
style="text-decoration: none; font-size: 10px; margin: 0;"
>
<img src="https://pikwizard.com/pw/medium/d92b0bcd994fd7a8c318a418d48862b4.jpg" style="margin: 0; width: 100%;" alt="" />
<p style="font-size: 12px; margin: 0;">PikWizard</p>
</a>
</span>
</span>
Free (free of charge)
Free for personal and commercial use.
Author: Authentic Images
Similar Free Stock Images

Premium


Premium


Premium


Premium


Premium


Premium


Premium


Premium


Premium


Premium


Premium


Premium


Premium


Premium


Premium


Premium


Premium


Premium


Premium


Premium


Premium


Premium


Premium


Premium

