
- Home >
- Stock Photos >
- Dynamic Statistical Data Analysis with Gradient Colors
Dynamic Statistical Data Analysis with Gradient Colors Image

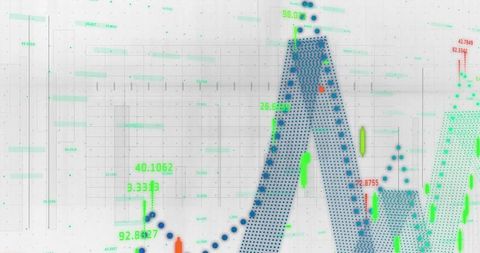
Shows digital statistical indicators with a combination of pink and green gradient colors. Useful in presentations focusing on business growth, market analysis, financial forecasting, and technology innovations. Chirpy visuals improve viewer engagement, making complex data appealing.
Powered by 


downloads
Tags:
More
Credit Photo
If you would like to credit the Photo, here are some ways you can do so
Text Link
photo Link
<span class="text-link">
<span>
<a target="_blank" href=https://pikwizard.com/photo/dynamic-statistical-data-analysis-with-gradient-colors/c61210421112ec88b15f0c4550a23d66/>PikWizard</a>
</span>
</span>
<span class="image-link">
<span
style="margin: 0 0 20px 0; display: inline-block; vertical-align: middle; width: 100%;"
>
<a
target="_blank"
href="https://pikwizard.com/photo/dynamic-statistical-data-analysis-with-gradient-colors/c61210421112ec88b15f0c4550a23d66/"
style="text-decoration: none; font-size: 10px; margin: 0;"
>
<img src="https://pikwizard.com/pw/medium/c61210421112ec88b15f0c4550a23d66.jpg" style="margin: 0; width: 100%;" alt="" />
<p style="font-size: 12px; margin: 0;">PikWizard</p>
</a>
</span>
</span>
Free (free of charge)
Free for personal and commercial use.
Author: Creative Art
Similar Free Stock Images

Premium


Premium

Premium


Premium


Premium


Premium


Premium


Premium

Premium

Premium

Premium


Premium


Premium


Premium


Premium


Premium


Premium


Premium


Premium


Premium


Premium


Premium


Premium


Premium


Premium

Explore More Free Stock Images