
- Home >
- Stock Photos >
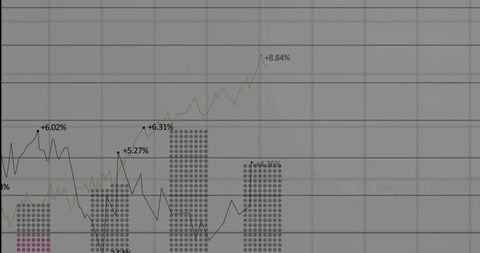
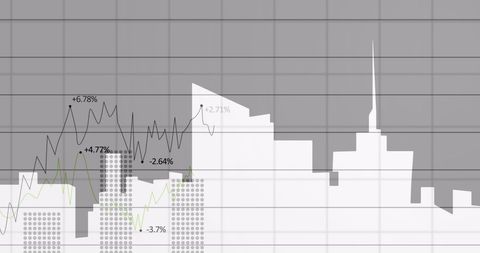
- Dynamic Statistical Data Over Grid Network Isolated on White
Dynamic Statistical Data Over Grid Network Isolated on White Image

The abstract visualization shows fluctuating statistical data overlaid on a grid network against a white backdrop, suggesting real-time data processing or analysis. It signifies finance, technological advancements, and analytical processes. Used in financial forecasts, investment strategies, technology services, or presentations, it can illustrate economic trends and graphical representations with dynamic visuals.
Powered by 


downloads
Tags:
More
Credit Photo
If you would like to credit the Photo, here are some ways you can do so
Text Link
photo Link
<span class="text-link">
<span>
<a target="_blank" href=https://pikwizard.com/photo/dynamic-statistical-data-over-grid-network-isolated-on-white/7ae76f492a23f61a8787626cb83a9f99/>PikWizard</a>
</span>
</span>
<span class="image-link">
<span
style="margin: 0 0 20px 0; display: inline-block; vertical-align: middle; width: 100%;"
>
<a
target="_blank"
href="https://pikwizard.com/photo/dynamic-statistical-data-over-grid-network-isolated-on-white/7ae76f492a23f61a8787626cb83a9f99/"
style="text-decoration: none; font-size: 10px; margin: 0;"
>
<img src="https://pikwizard.com/pw/medium/7ae76f492a23f61a8787626cb83a9f99.jpg" style="margin: 0; width: 100%;" alt="" />
<p style="font-size: 12px; margin: 0;">PikWizard</p>
</a>
</span>
</span>
Free (free of charge)
Free for personal and commercial use.
Author: Awesome Content
Similar Free Stock Images

Premium


Premium

Premium


Premium


Premium


Premium


Premium


Premium


Premium

Premium

Premium


Premium


Premium


Premium


Premium


Premium


Premium


Premium


Premium


Premium

Premium


Premium


Premium


Premium


Premium

Explore More Free Stock Images