- Home >
- Stock Photos >
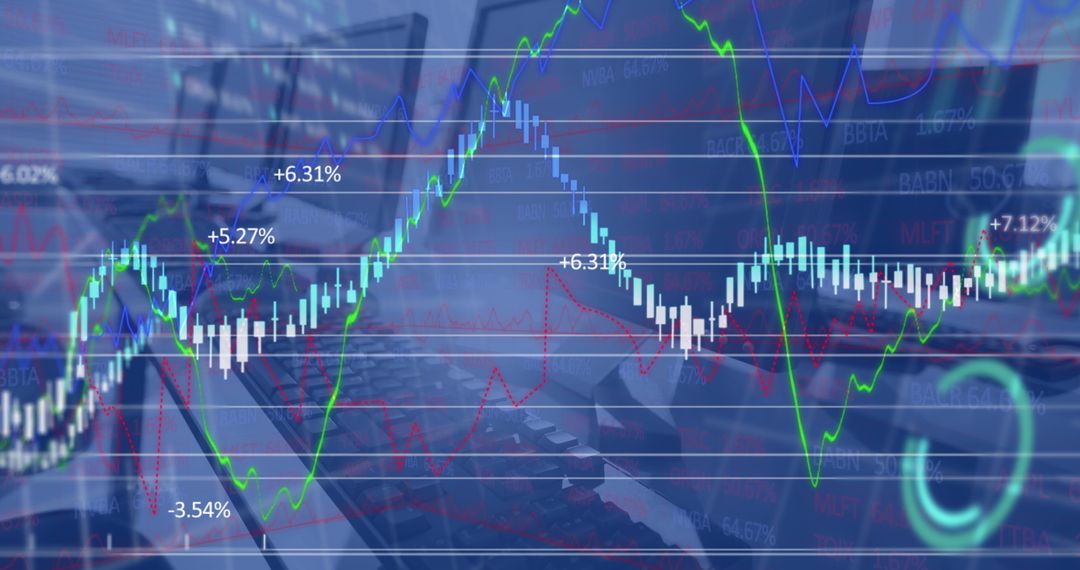
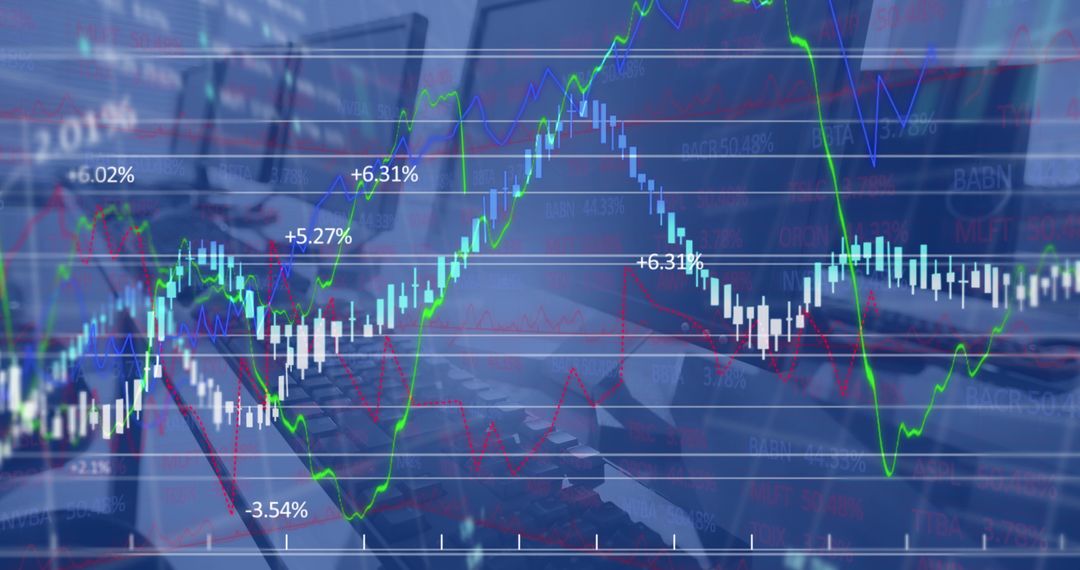
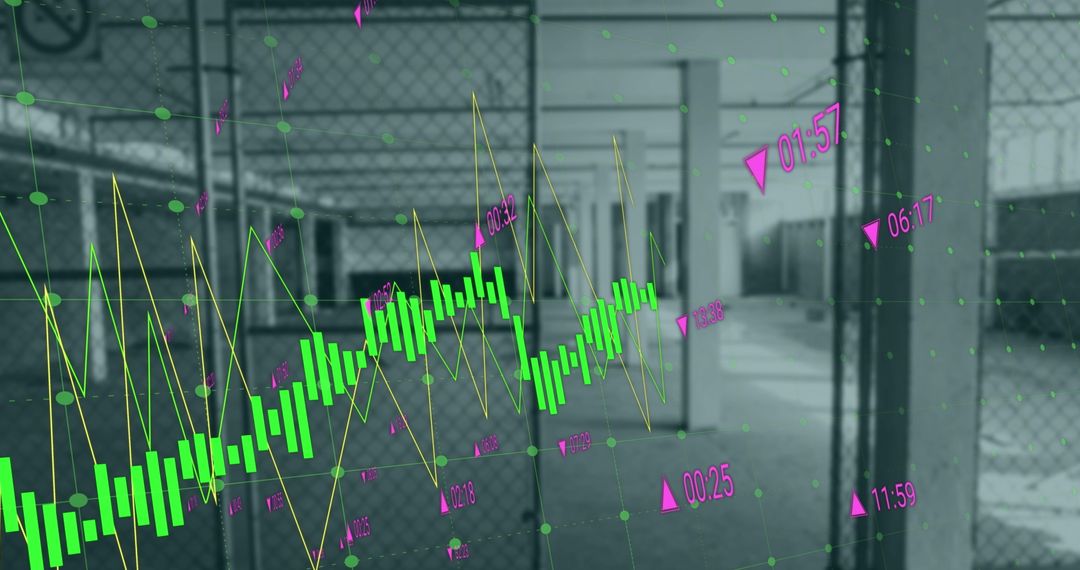
- Dynamic Stock Charts Intertwined with Boardroom Image
Dynamic Stock Charts Intertwined with Boardroom Image Image

This digital composite merges financial trading charts with the image of chairs, highlighting themes of market analysis and business growth. Ideal for financial reports, business presentations, or articles focusing on stock market dynamics and business strategy.
Powered by 


2
downloads
downloads
Tags:
More
Credit Photo
If you would like to credit the Photo, here are some ways you can do so
Text Link
photo Link
<span class="text-link">
<span>
<a target="_blank" href=https://pikwizard.com/photo/dynamic-stock-charts-intertwined-with-boardroom-image/23f21ce19e879cb5d0bc978a062ce795/>PikWizard</a>
</span>
</span>
<span class="image-link">
<span
style="margin: 0 0 20px 0; display: inline-block; vertical-align: middle; width: 100%;"
>
<a
target="_blank"
href="https://pikwizard.com/photo/dynamic-stock-charts-intertwined-with-boardroom-image/23f21ce19e879cb5d0bc978a062ce795/"
style="text-decoration: none; font-size: 10px; margin: 0;"
>
<img src="https://pikwizard.com/pw/medium/23f21ce19e879cb5d0bc978a062ce795.jpg" style="margin: 0; width: 100%;" alt="" />
<p style="font-size: 12px; margin: 0;">PikWizard</p>
</a>
</span>
</span>
Free (free of charge)
Free for personal and commercial use.
Author: Creative Art
Similar Free Stock Images

Premium


Premium


Premium


Premium


Premium


Premium


Premium


Premium


Premium


Premium


Premium


Premium


Premium


Premium


Premium


Premium


Premium


Premium


Premium


Premium


Premium


Premium


Premium


Premium