
- Home >
- Stock Photos >
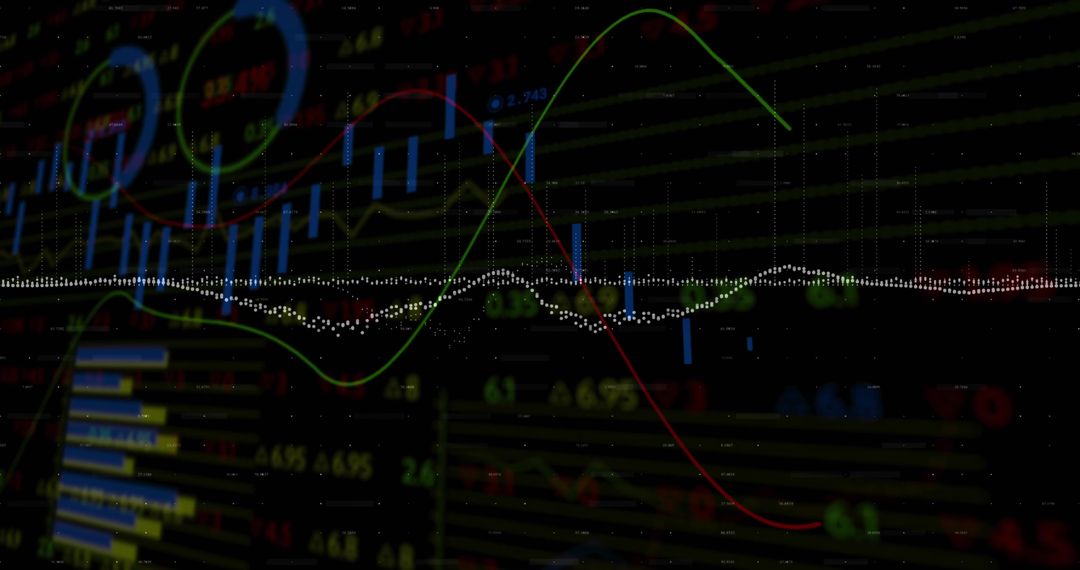
- Dynamic Stock Exchange Analysis with Moving Financial Graphs
Dynamic Stock Exchange Analysis with Moving Financial Graphs Image

Colorful graphs, numerical fluctuations show stock market's dynamic nature, valuable for business and financial presentations depicting market trends and economic analysis.
Powered by 


2
downloads
downloads
Tags:
More
Credit Photo
If you would like to credit the Photo, here are some ways you can do so
Text Link
photo Link
<span class="text-link">
<span>
<a target="_blank" href=https://pikwizard.com/photo/dynamic-stock-exchange-analysis-with-moving-financial-graphs/e0f0545641fb4cf3d650ab1e3031f076/>PikWizard</a>
</span>
</span>
<span class="image-link">
<span
style="margin: 0 0 20px 0; display: inline-block; vertical-align: middle; width: 100%;"
>
<a
target="_blank"
href="https://pikwizard.com/photo/dynamic-stock-exchange-analysis-with-moving-financial-graphs/e0f0545641fb4cf3d650ab1e3031f076/"
style="text-decoration: none; font-size: 10px; margin: 0;"
>
<img src="https://pikwizard.com/pw/medium/e0f0545641fb4cf3d650ab1e3031f076.jpg" style="margin: 0; width: 100%;" alt="" />
<p style="font-size: 12px; margin: 0;">PikWizard</p>
</a>
</span>
</span>
Free (free of charge)
Free for personal and commercial use.
Author: People Creations
Similar Free Stock Images

Premium


Premium


Premium


Premium


Premium


Premium


Premium


Premium


Premium


Premium


Premium


Premium


Premium


Premium


Premium


Premium


Premium


Premium


Premium


Premium


Premium


Premium


Premium


Premium

