- Home >
- Stock Photos >
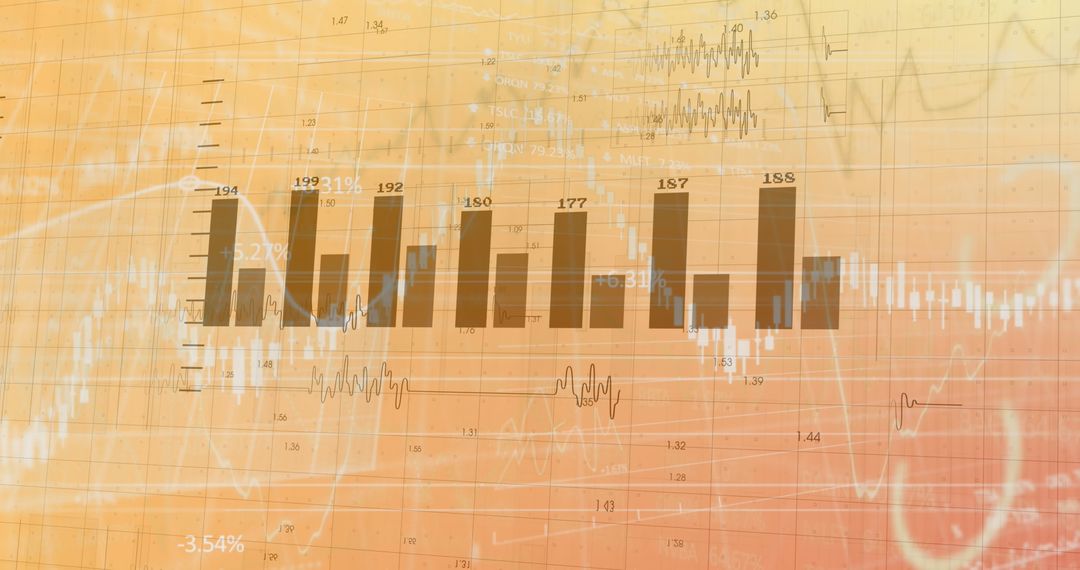
- Dynamic Stock Market Analysis on Pink Background
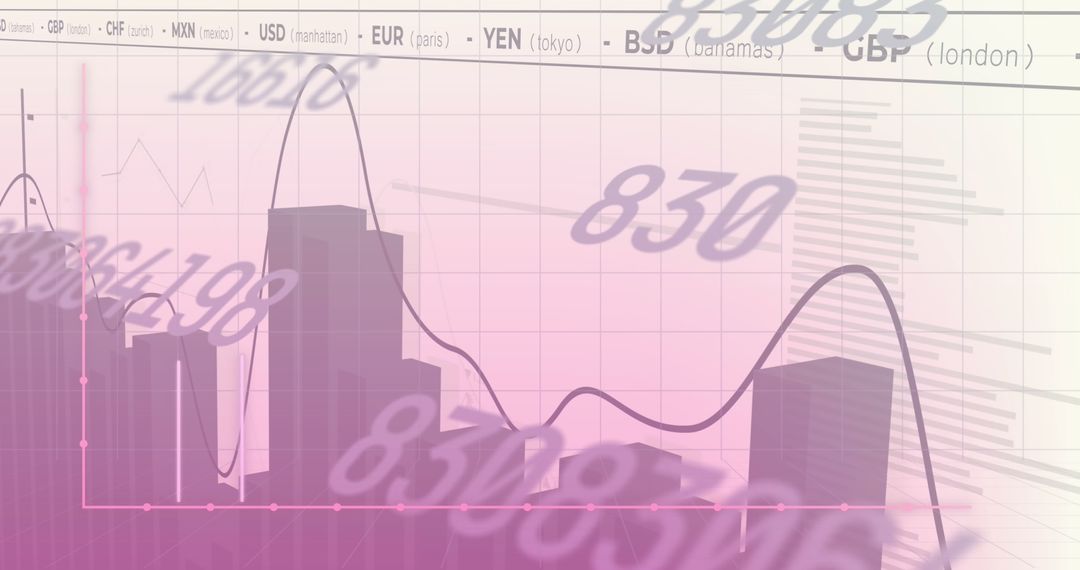
Dynamic Stock Market Analysis on Pink Background Image

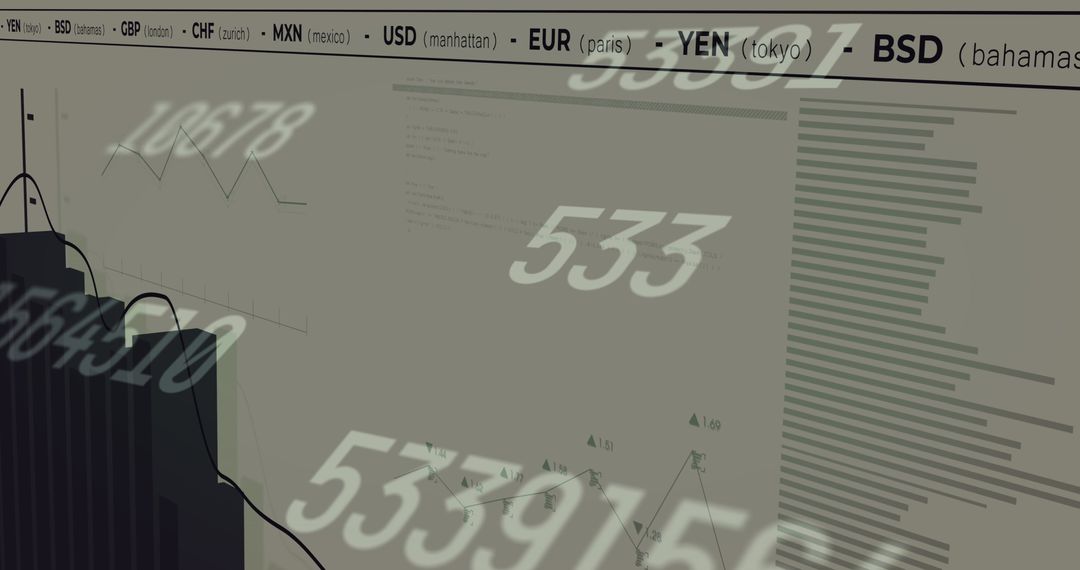
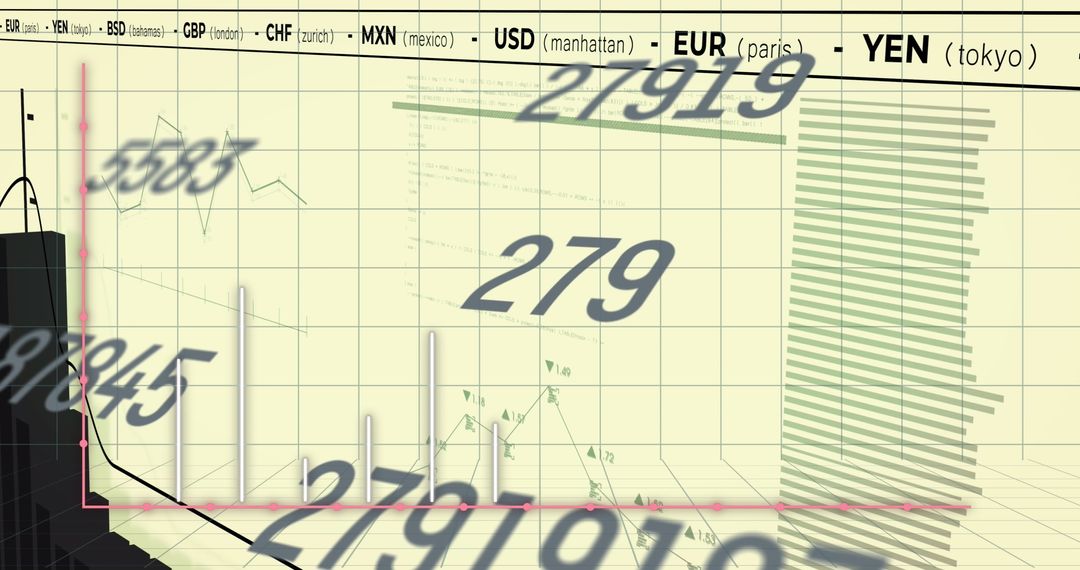
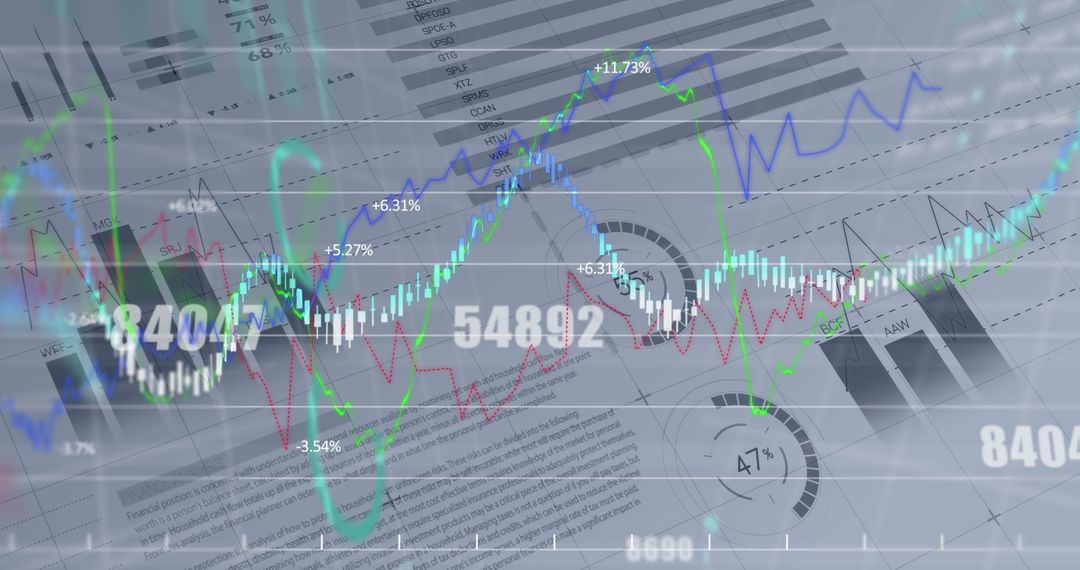
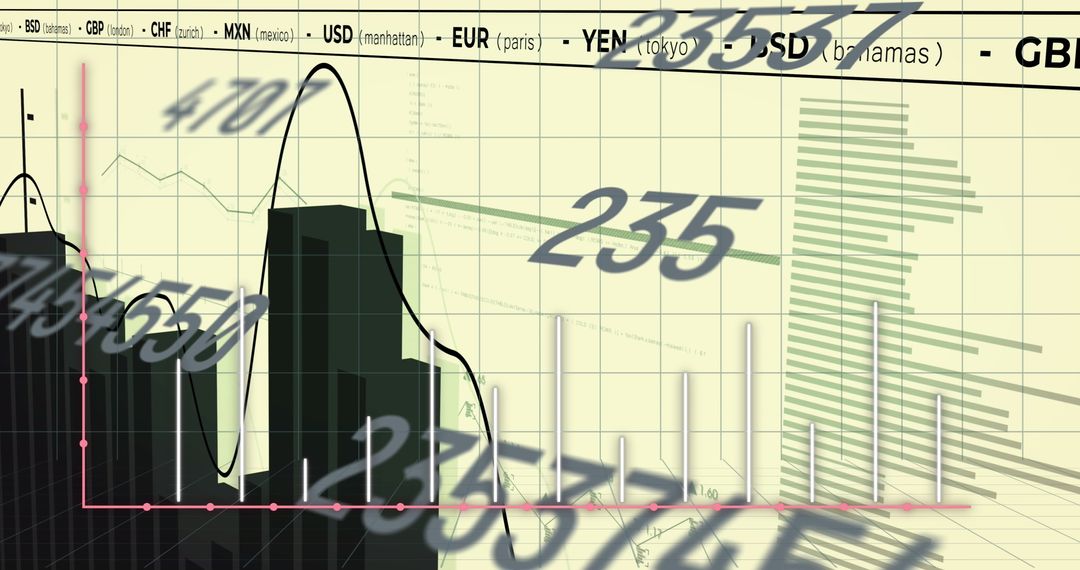
Illustrates fluctuating stock values with graphic representations and numerical data overlays in a vibrant setting. Useful for presentations on financial trends, investment strategies, economic research, and technology in business analytics.
Powered by 


24
downloads
downloads
Tags:
More
Credit Photo
If you would like to credit the Photo, here are some ways you can do so
Text Link
photo Link
<span class="text-link">
<span>
<a target="_blank" href=https://pikwizard.com/photo/dynamic-stock-market-analysis-on-pink-background/d7f90d29eb70e44c0f855ea8a1702779/>PikWizard</a>
</span>
</span>
<span class="image-link">
<span
style="margin: 0 0 20px 0; display: inline-block; vertical-align: middle; width: 100%;"
>
<a
target="_blank"
href="https://pikwizard.com/photo/dynamic-stock-market-analysis-on-pink-background/d7f90d29eb70e44c0f855ea8a1702779/"
style="text-decoration: none; font-size: 10px; margin: 0;"
>
<img src="https://pikwizard.com/pw/medium/d7f90d29eb70e44c0f855ea8a1702779.jpg" style="margin: 0; width: 100%;" alt="" />
<p style="font-size: 12px; margin: 0;">PikWizard</p>
</a>
</span>
</span>
Free (free of charge)
Free for personal and commercial use.
Author: People Creations
Similar Free Stock Images

Premium


Premium


Premium


Premium


Premium


Premium


Premium


Premium


Premium


Premium


Premium


Premium


Premium


Premium


Premium


Premium


Premium


Premium


Premium


Premium


Premium


Premium


Premium


Premium