- Home >
- Stock Photos >
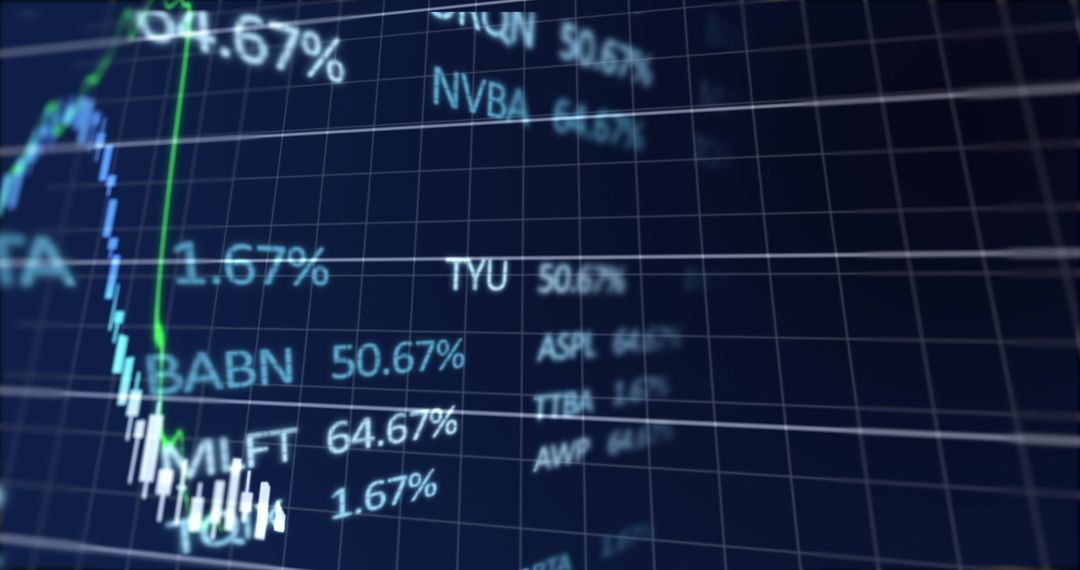
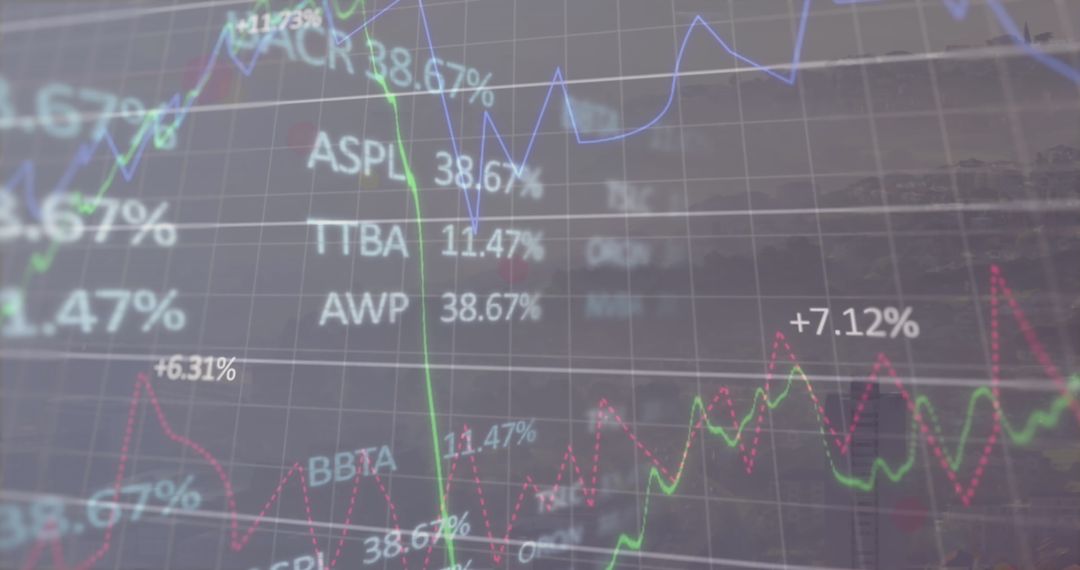
- Dynamic Stock Market Analysis with Blue Graphs and Percentages
Dynamic Stock Market Analysis with Blue Graphs and Percentages Image

This visual representation of dynamic stock market activity features blue graphs over a black background, highlighting market trends and growth potential in real time. Helpful in illustrating concepts of financial analysis, economic growth, dynamic trading, or for educational use in market analysis discussions.
Powered by 


2
downloads
downloads
Tags:
More
Credit Photo
If you would like to credit the Photo, here are some ways you can do so
Text Link
photo Link
<span class="text-link">
<span>
<a target="_blank" href=https://pikwizard.com/photo/dynamic-stock-market-analysis-with-blue-graphs-and-percentages/21e9b9f07fb43ccd3470a875d4d8e616/>PikWizard</a>
</span>
</span>
<span class="image-link">
<span
style="margin: 0 0 20px 0; display: inline-block; vertical-align: middle; width: 100%;"
>
<a
target="_blank"
href="https://pikwizard.com/photo/dynamic-stock-market-analysis-with-blue-graphs-and-percentages/21e9b9f07fb43ccd3470a875d4d8e616/"
style="text-decoration: none; font-size: 10px; margin: 0;"
>
<img src="https://pikwizard.com/pw/medium/21e9b9f07fb43ccd3470a875d4d8e616.jpg" style="margin: 0; width: 100%;" alt="" />
<p style="font-size: 12px; margin: 0;">PikWizard</p>
</a>
</span>
</span>
Free (free of charge)
Free for personal and commercial use.
Author: Creative Art
Similar Free Stock Images

Premium


Premium


Premium


Premium


Premium


Premium


Premium


Premium


Premium


Premium


Premium


Premium


Premium


Premium


Premium


Premium


Premium


Premium


Premium


Premium


Premium


Premium


Premium


Premium