- Home >
- Stock Photos >
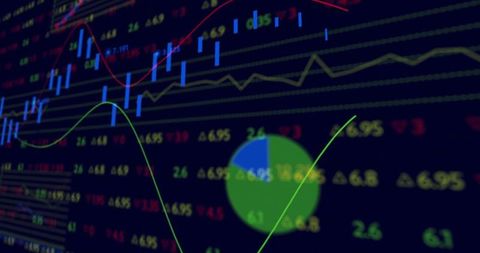
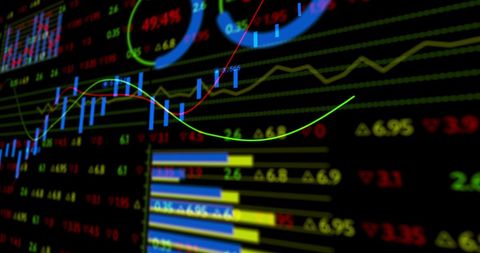
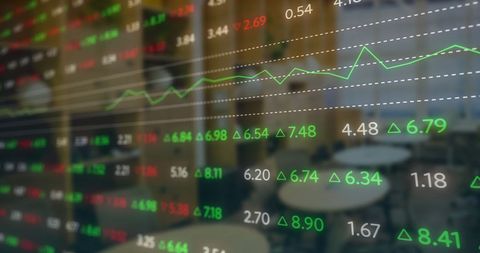
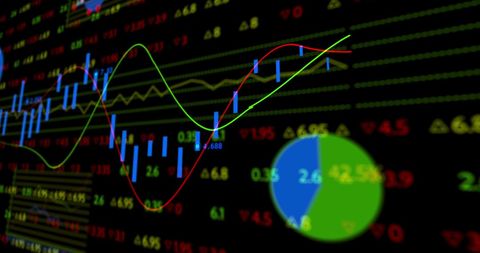
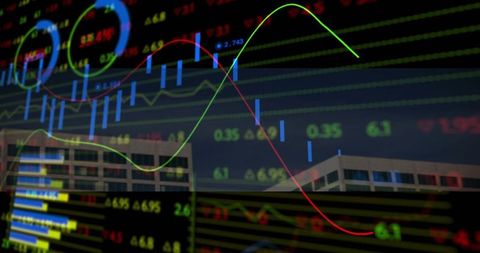
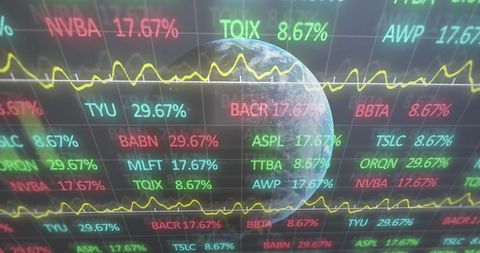
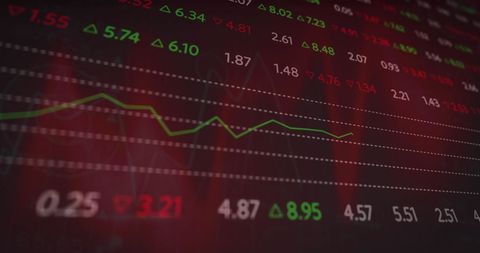
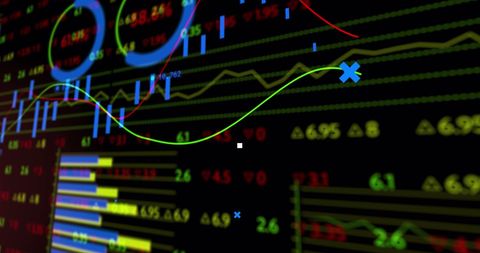
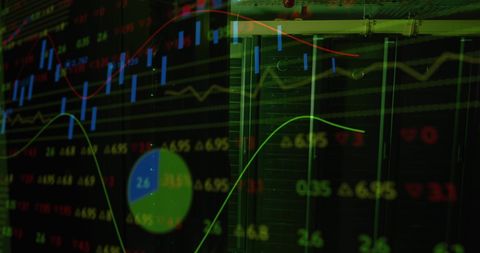
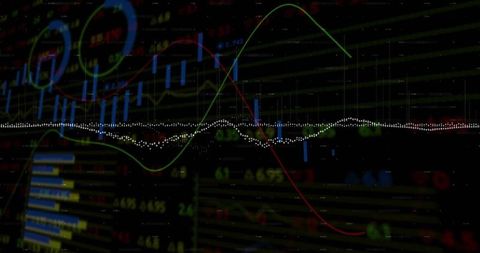
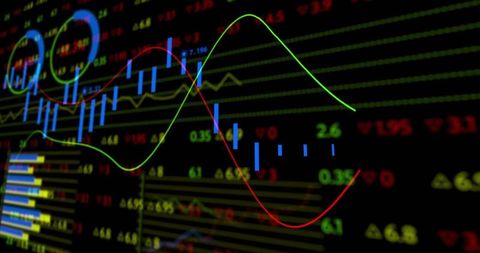
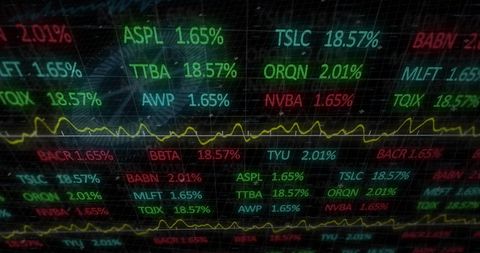
- Dynamic Stock Market Analysis with Candlestick Data Chart
Dynamic Stock Market Analysis with Candlestick Data Chart Image

This visualization shows a detailed stock market analysis with candlestick charts and trend lines, useful for traders, financial analysts, and economists. By illustrating percentages and trends, it can be employed for presentations, reporting, investment strategy planning, and educational tools to demonstrate real-time data tracking and financial modeling.

downloads
Tags:
More
Credit Photo
If you would like to credit the Photo, here are some ways you can do so
Text Link
photo Link
<span class="text-link">
<span>
<a target="_blank" href=https://pikwizard.com/photo/dynamic-stock-market-analysis-with-candlestick-data-chart/af347c8f4aa9e1f1910f137bc5c6c5d3/>PikWizard</a>
</span>
</span>
<span class="image-link">
<span
style="margin: 0 0 20px 0; display: inline-block; vertical-align: middle; width: 100%;"
>
<a
target="_blank"
href="https://pikwizard.com/photo/dynamic-stock-market-analysis-with-candlestick-data-chart/af347c8f4aa9e1f1910f137bc5c6c5d3/"
style="text-decoration: none; font-size: 10px; margin: 0;"
>
<img src="https://pikwizard.com/pw/medium/af347c8f4aa9e1f1910f137bc5c6c5d3.jpg" style="margin: 0; width: 100%;" alt="" />
<p style="font-size: 12px; margin: 0;">PikWizard</p>
</a>
</span>
</span>
Free (free of charge)
Free for personal and commercial use.
Author: Creative Art