- Home >
- Stock Photos >
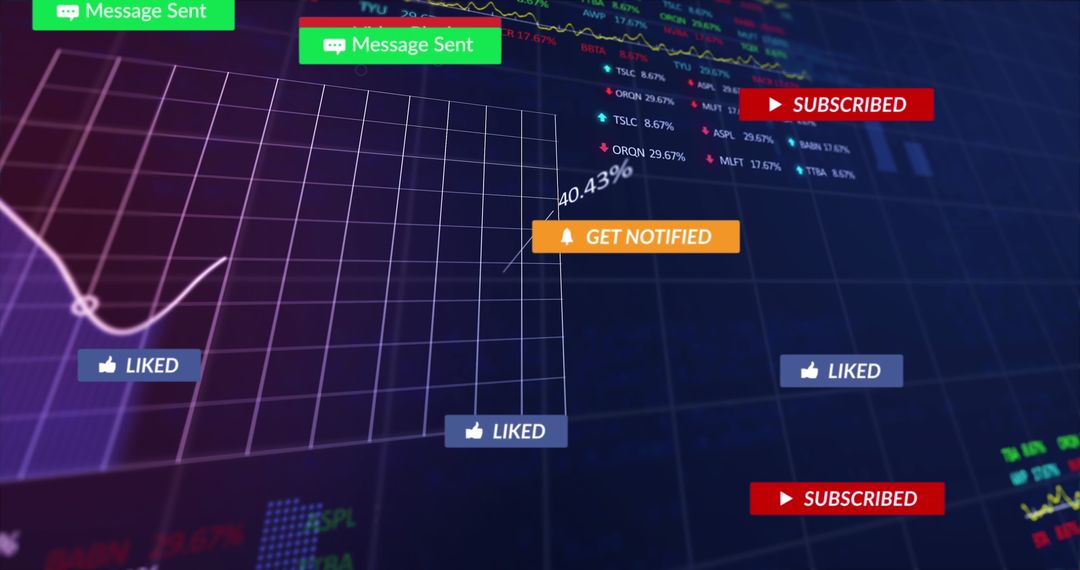
- Dynamic Stock Market Analysis with Data and Trends Visualization
Dynamic Stock Market Analysis with Data and Trends Visualization Image

Data-driven scene showing various components of stock market analysis like graphs and charts to represent financial data. Useful for presentations on economic trends, investment strategies, and financial market updates. Serves well for websites dealing with finance and market news.
Powered by  - Get 15% off with code: PIKWIZARD15


2
downloads
downloads
Tags:
More
Credit Photo
If you would like to credit the Photo, here are some ways you can do so
Text Link
photo Link
<span class="text-link">
<span>
<a target="_blank" href=https://pikwizard.com/photo/dynamic-stock-market-analysis-with-data-and-trends-visualization/05f9d6b1dd5d28e8dd792d793f1d5699/>PikWizard</a>
</span>
</span>
<span class="image-link">
<span
style="margin: 0 0 20px 0; display: inline-block; vertical-align: middle; width: 100%;"
>
<a
target="_blank"
href="https://pikwizard.com/photo/dynamic-stock-market-analysis-with-data-and-trends-visualization/05f9d6b1dd5d28e8dd792d793f1d5699/"
style="text-decoration: none; font-size: 10px; margin: 0;"
>
<img src="https://pikwizard.com/pw/medium/05f9d6b1dd5d28e8dd792d793f1d5699.jpg" style="margin: 0; width: 100%;" alt="" />
<p style="font-size: 12px; margin: 0;">PikWizard</p>
</a>
</span>
</span>
Free (free of charge)
Free for personal and commercial use.
Author: Awesome Content
Similar Free Stock Images

Premium


Premium


Premium


Premium


Premium


Premium


Premium


Premium


Premium


Premium


Premium


Premium


Premium


Premium


Premium


Premium


Premium


Premium


Premium


Premium


Premium


Premium


Premium


Premium