
- Home >
- Stock Photos >
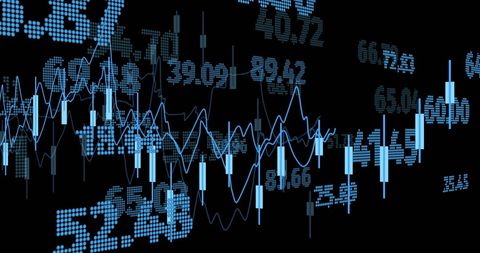
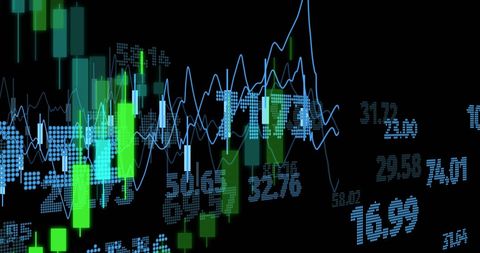
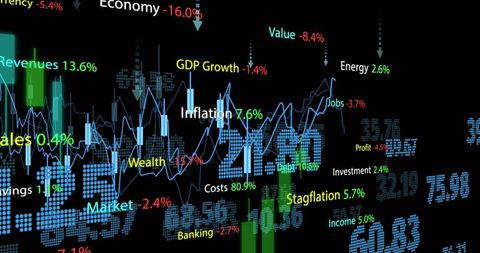
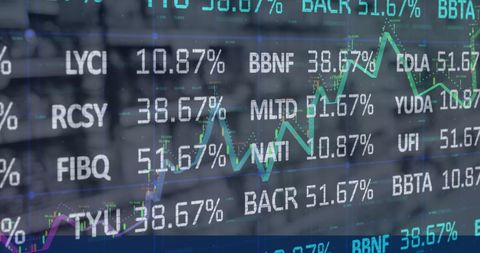
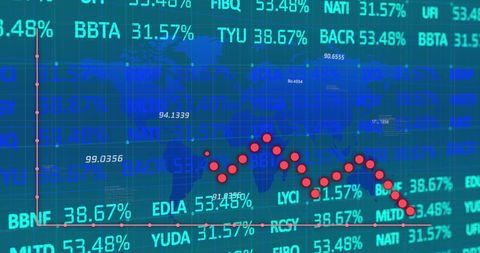
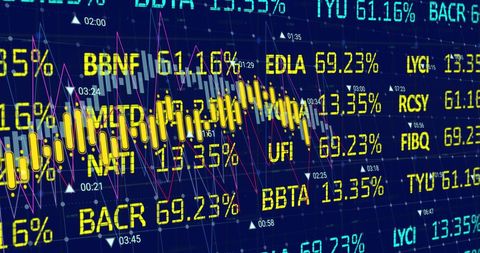
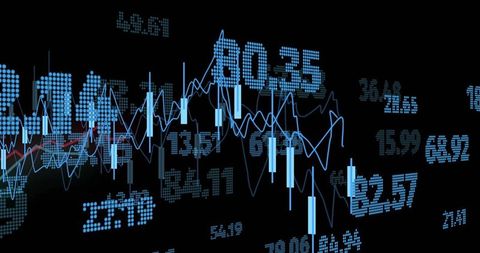
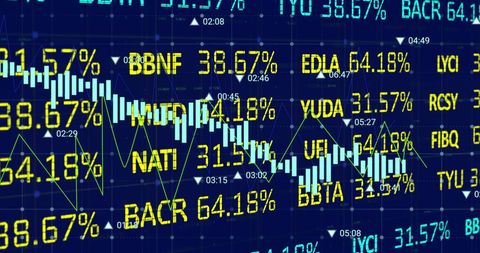
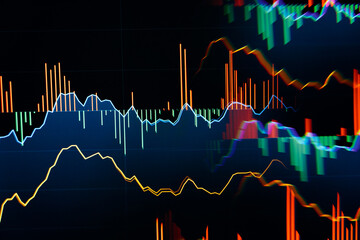
- Dynamic Stock Market Analysis with Digital Data Visualization
Dynamic Stock Market Analysis with Digital Data Visualization Image
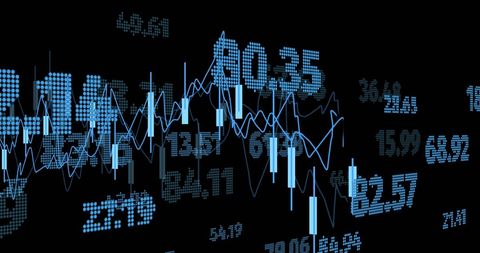
Displays conceptual visualization of stock market fluctuations through dynamic graphs with numbers, set against a black background. Ideal for use in business presentations, financial forecasts, investment analyses, and articles discussing market trends and technology in finance.
Powered by 


downloads
Tags:
More
Credit Photo
If you would like to credit the Photo, here are some ways you can do so
Text Link
photo Link
<span class="text-link">
<span>
<a target="_blank" href=https://pikwizard.com/photo/dynamic-stock-market-analysis-with-digital-data-visualization/7159658967e54faaeb22f1f7f5a5c5b0/>PikWizard</a>
</span>
</span>
<span class="image-link">
<span
style="margin: 0 0 20px 0; display: inline-block; vertical-align: middle; width: 100%;"
>
<a
target="_blank"
href="https://pikwizard.com/photo/dynamic-stock-market-analysis-with-digital-data-visualization/7159658967e54faaeb22f1f7f5a5c5b0/"
style="text-decoration: none; font-size: 10px; margin: 0;"
>
<img src="https://pikwizard.com/pw/medium/7159658967e54faaeb22f1f7f5a5c5b0.jpg" style="margin: 0; width: 100%;" alt="" />
<p style="font-size: 12px; margin: 0;">PikWizard</p>
</a>
</span>
</span>
Free (free of charge)
Free for personal and commercial use.
Author: People Creations
Similar Free Stock Images

Premium


Premium


Premium


Premium


Premium


Premium


Premium

Premium


Premium


Premium


Premium


Premium

Premium

Premium

Premium


Premium


Premium


Premium

Premium


Premium

Premium


Premium

Premium


Premium


Premium


Explore More Free Stock Images