- Home >
- Stock Photos >
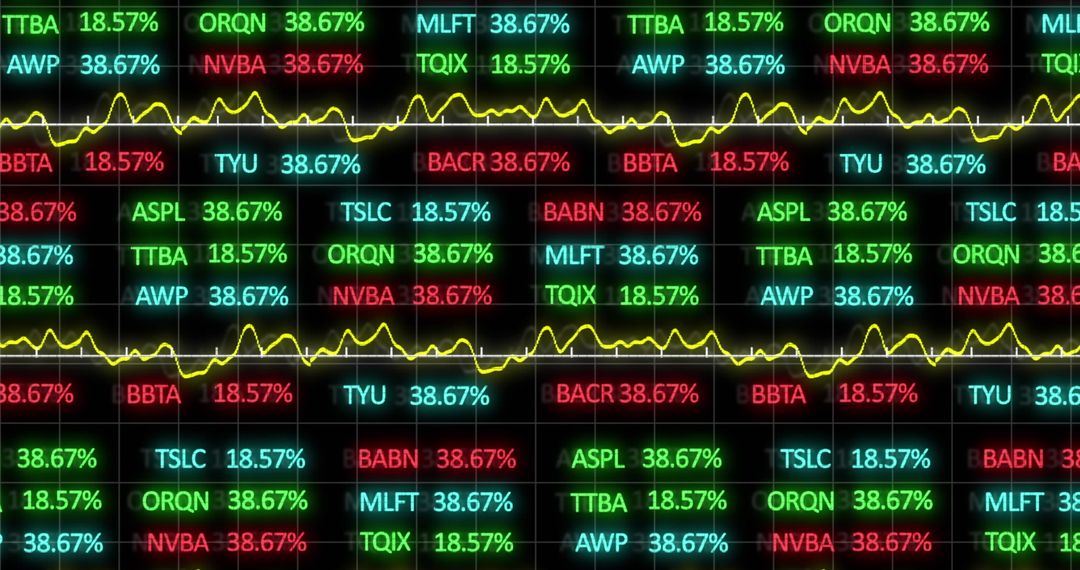
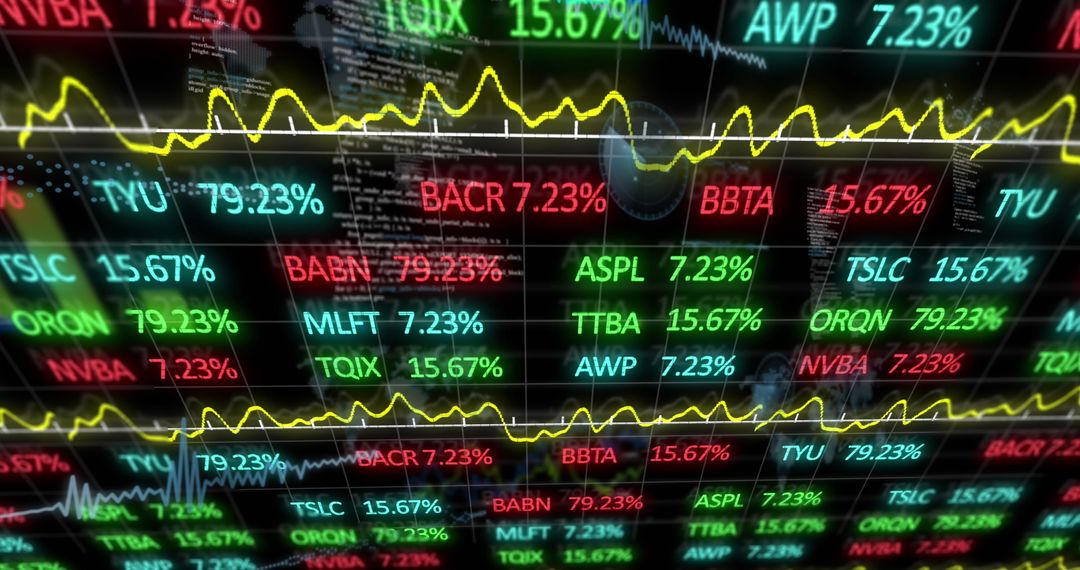
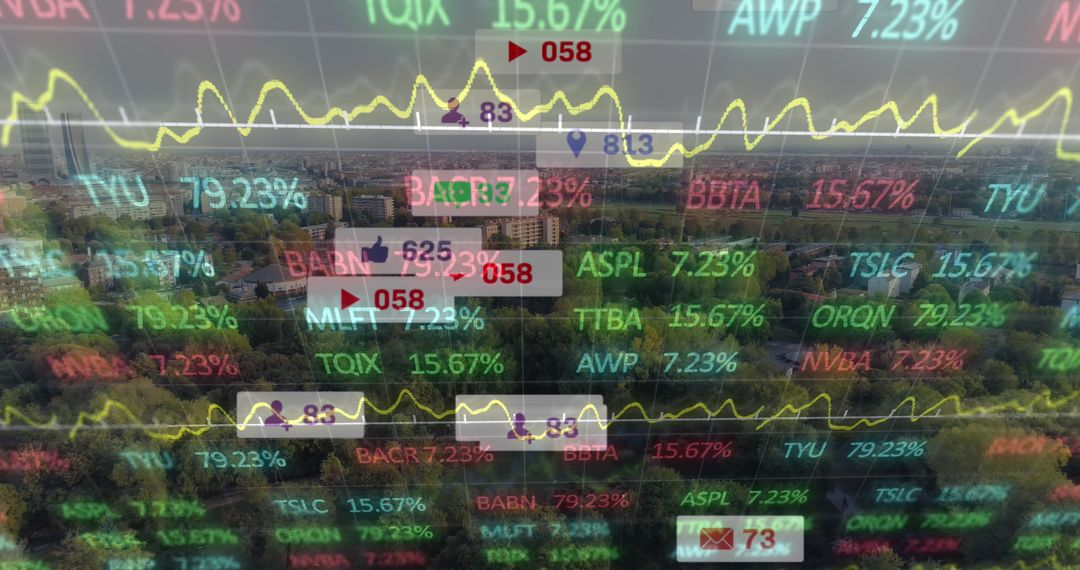
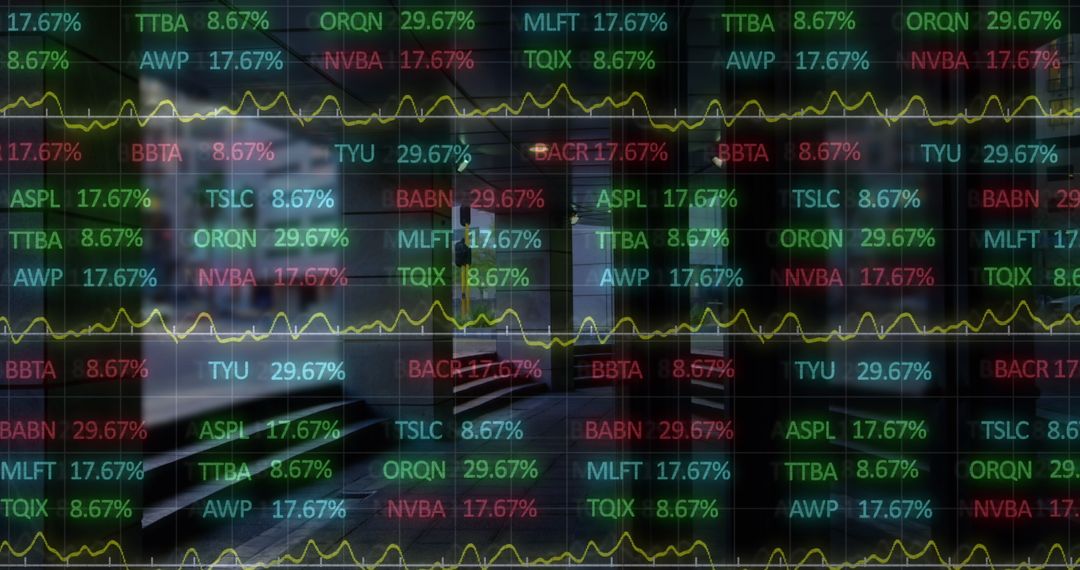
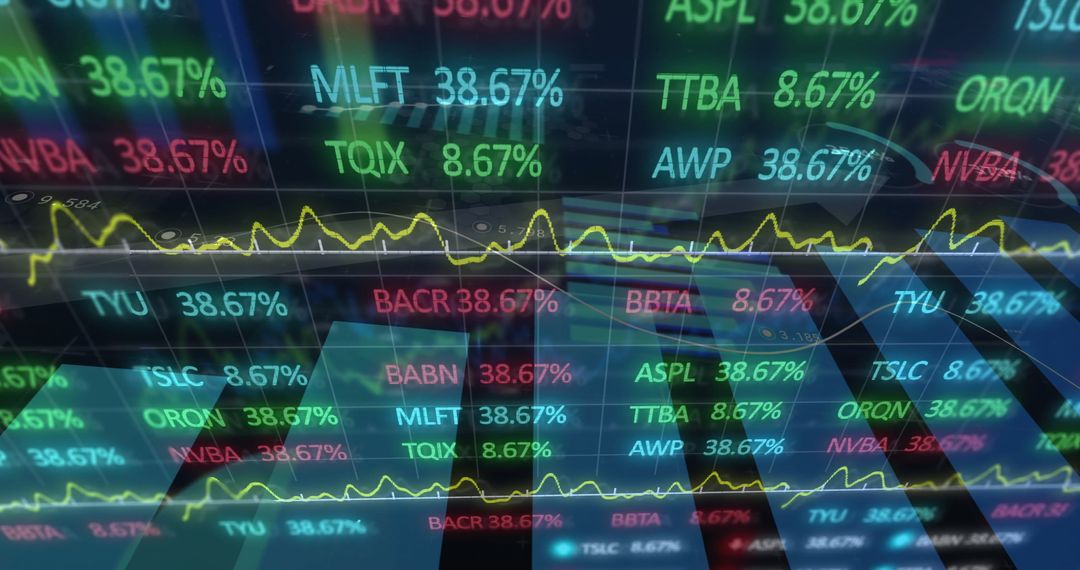
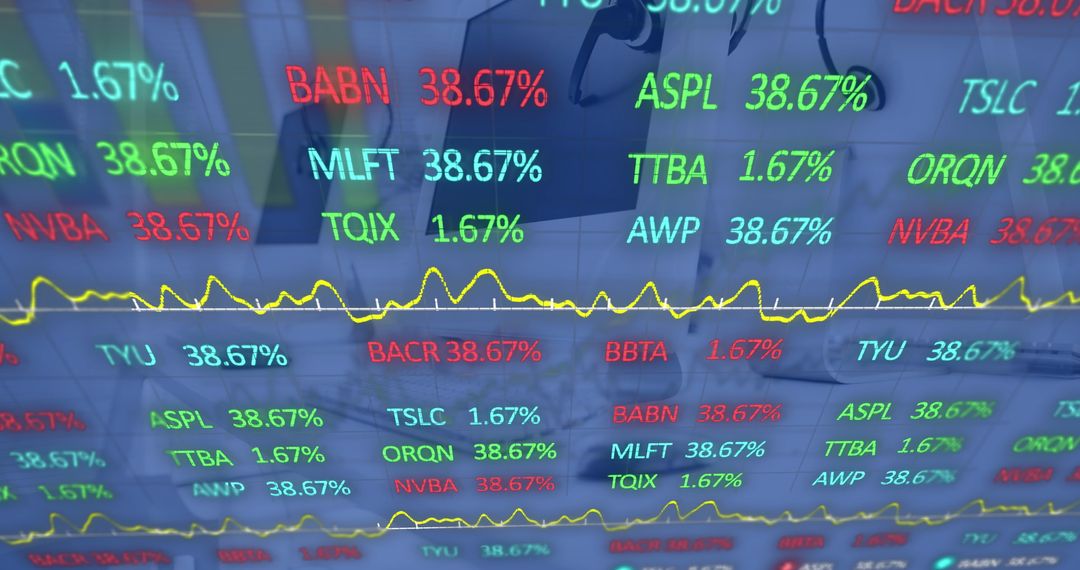
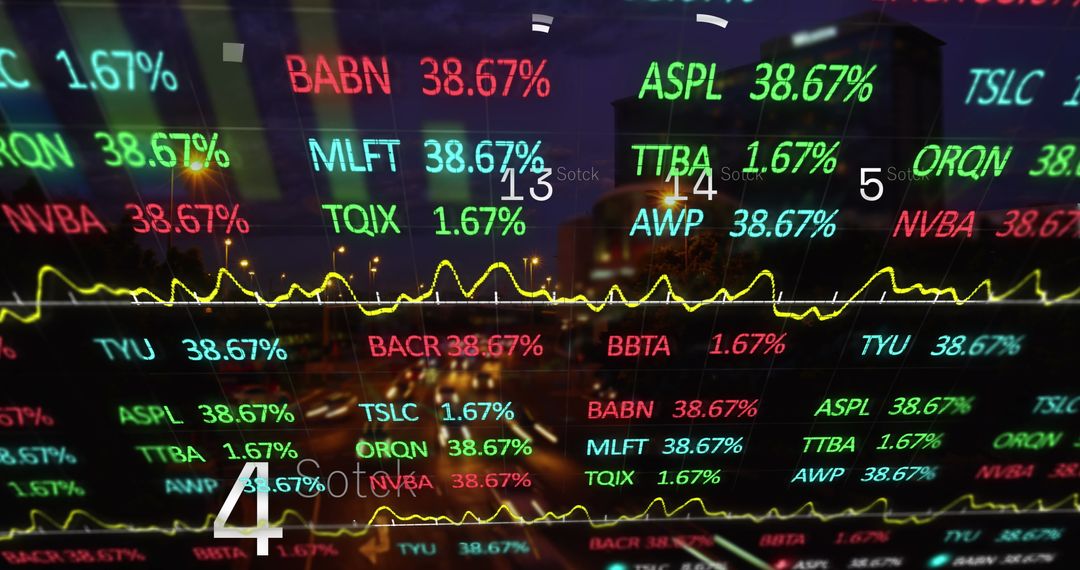
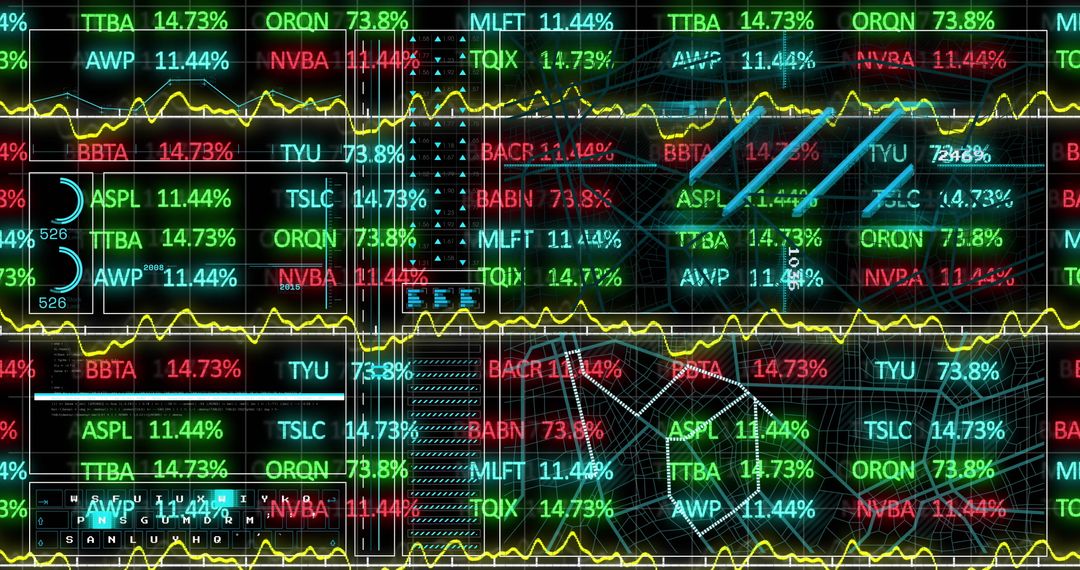
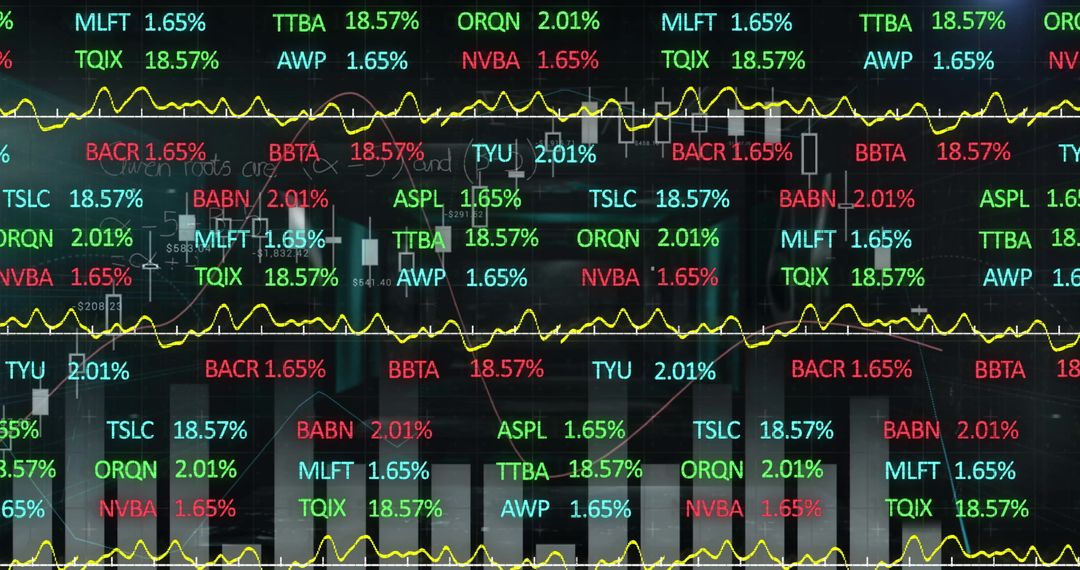
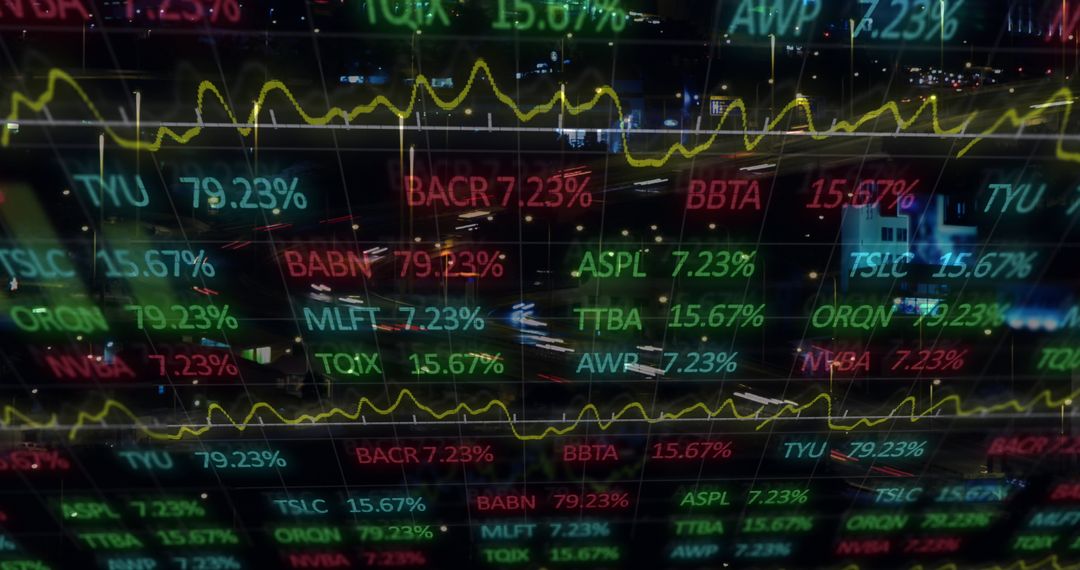
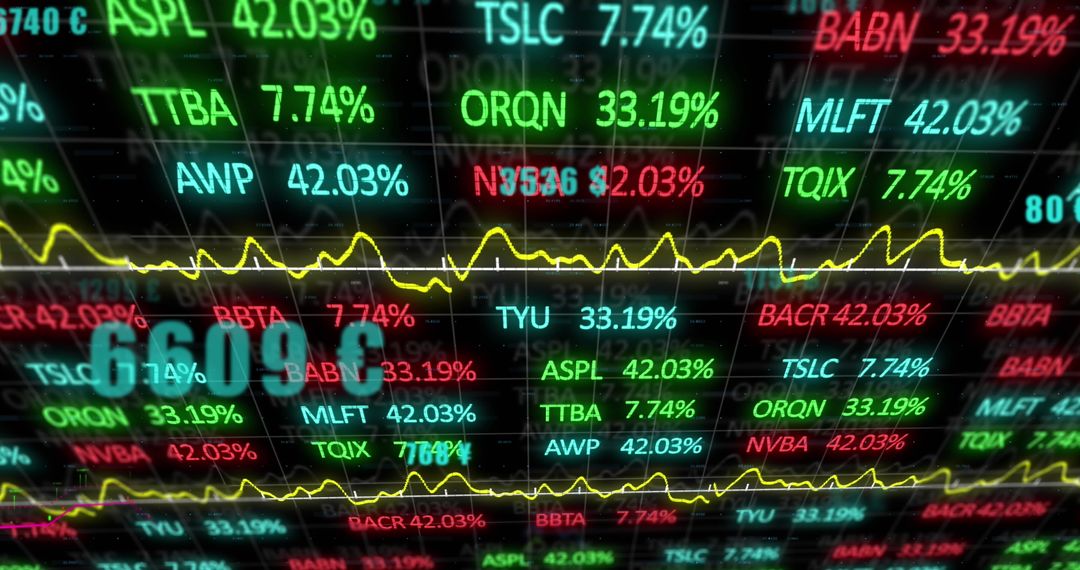
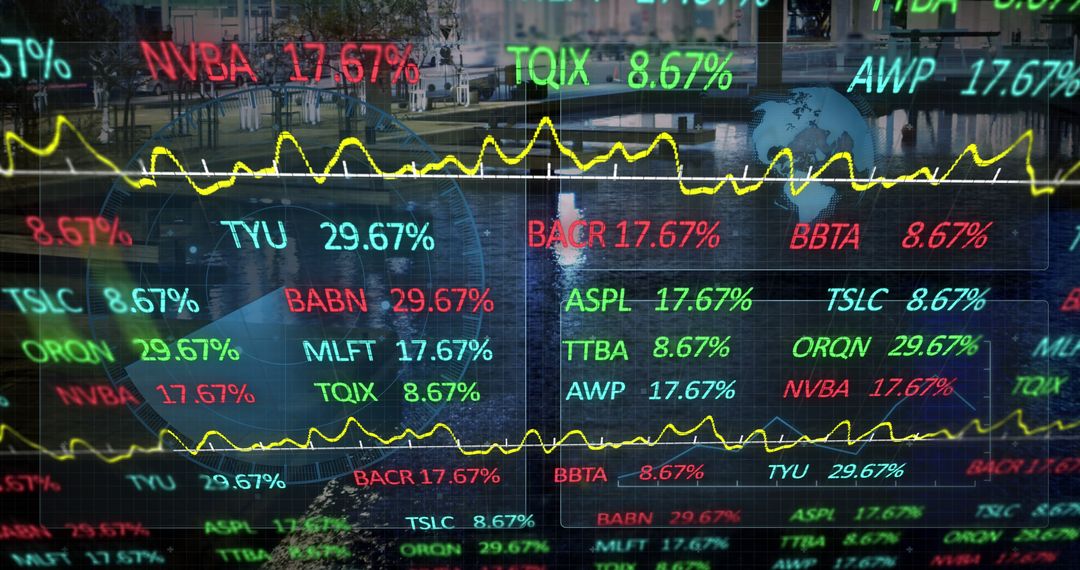
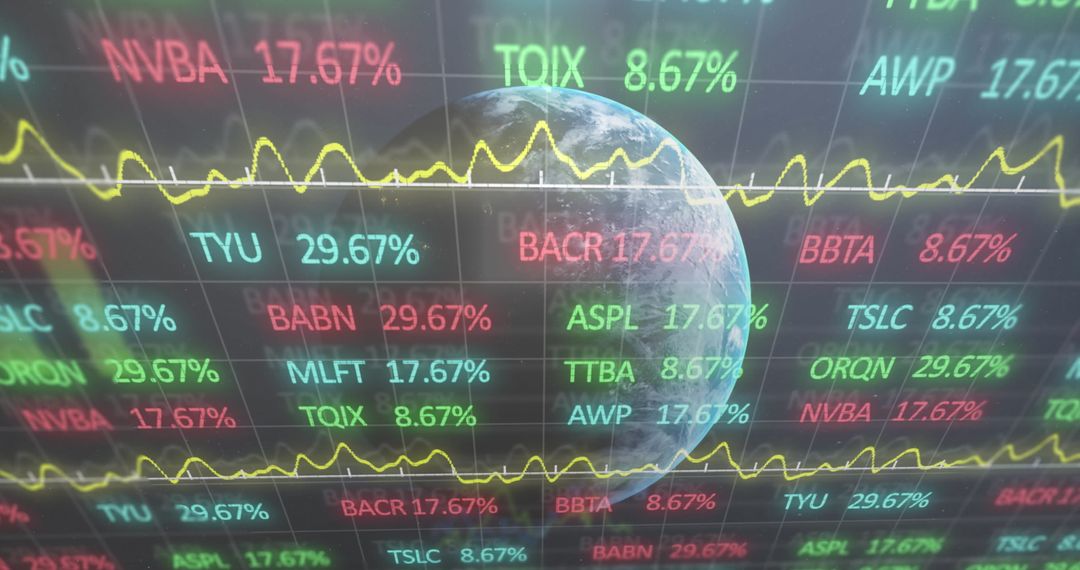
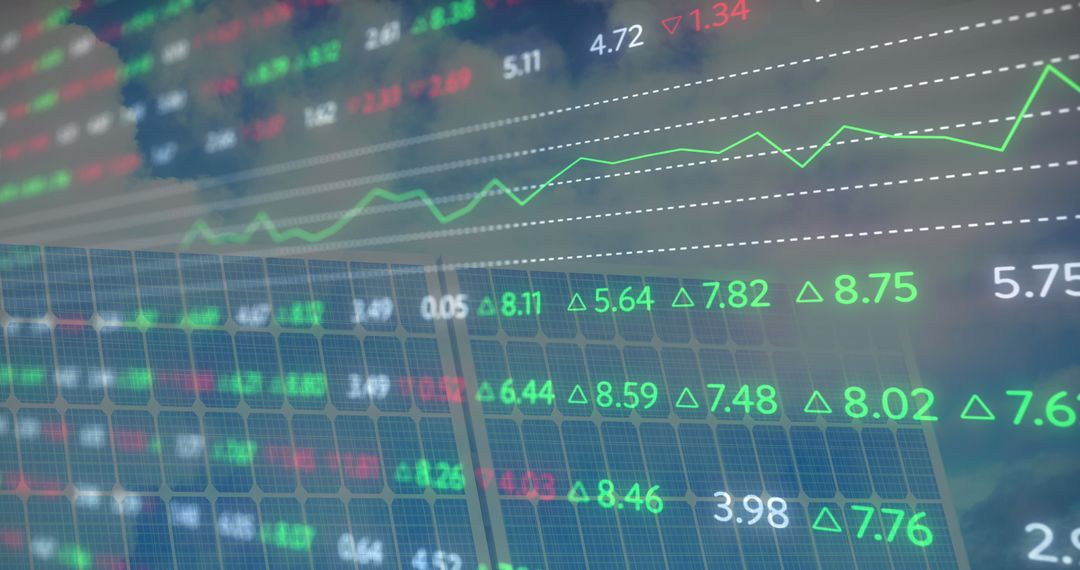
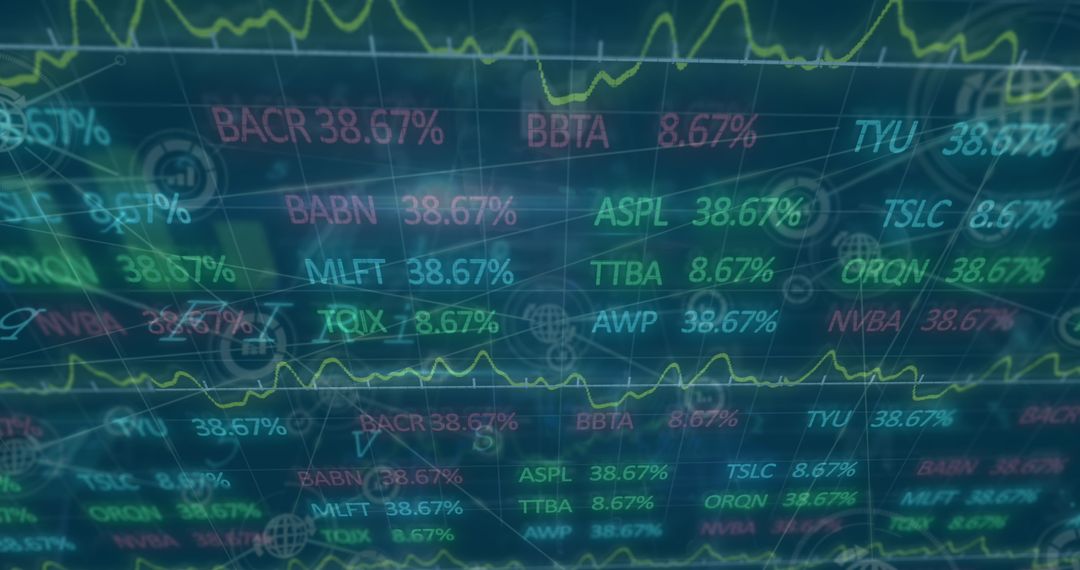
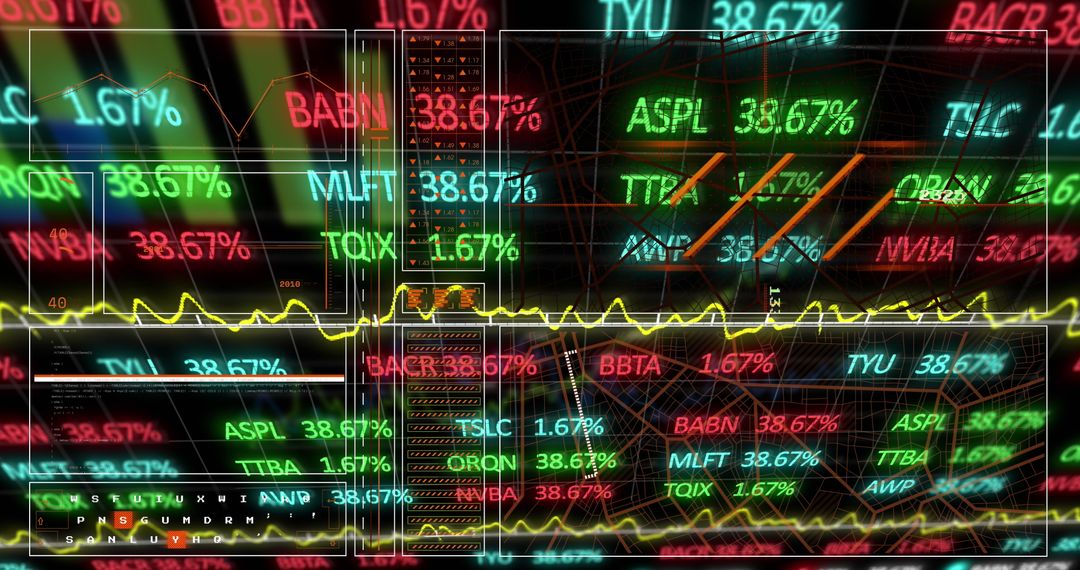
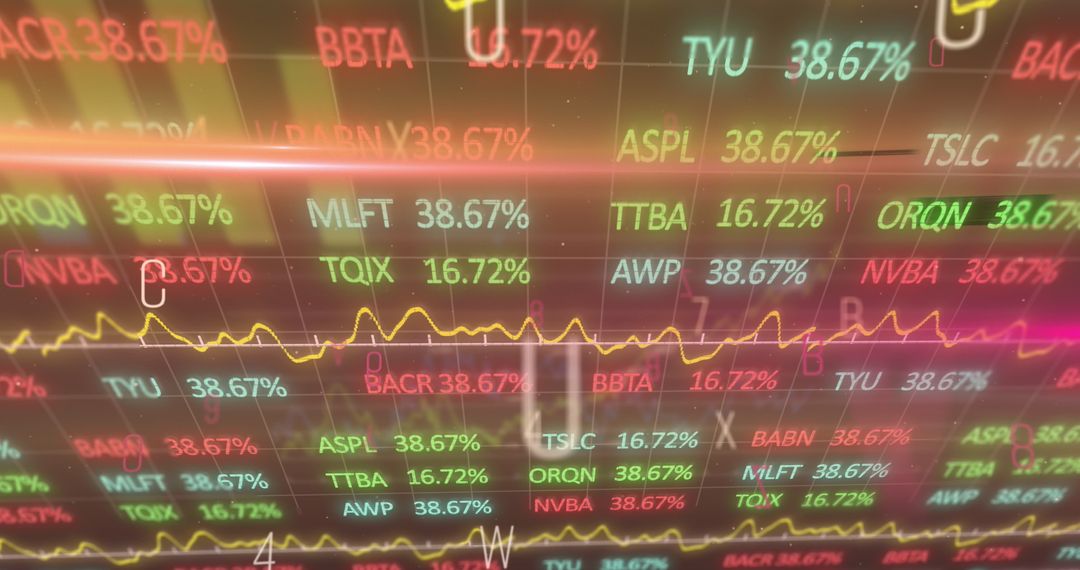
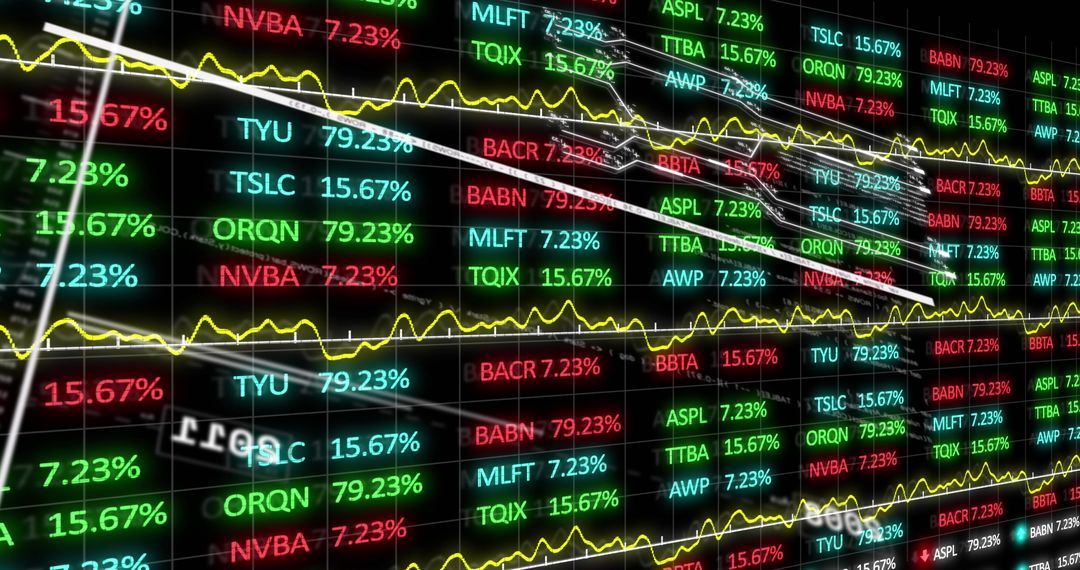
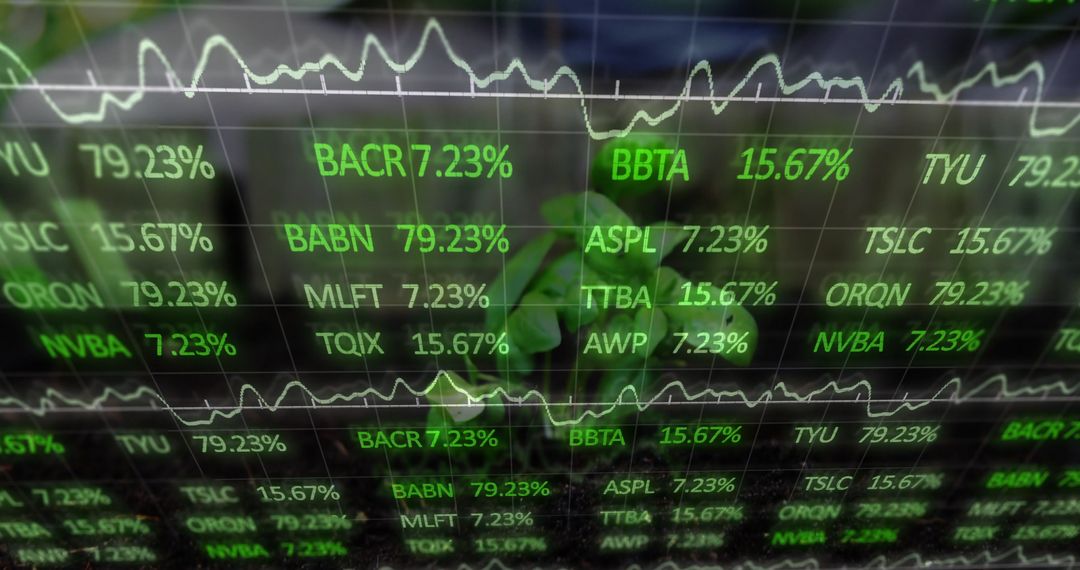
- Dynamic Stock Market Analysis with Digital Tickers and Bar Graphs
Dynamic Stock Market Analysis with Digital Tickers and Bar Graphs Image
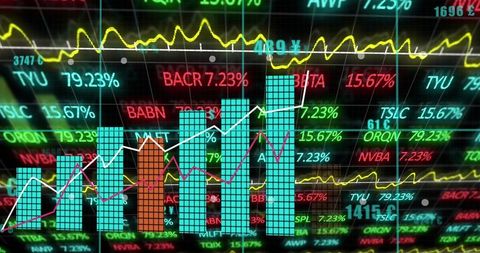
This image is ideal for illustrating concepts related to stock market dynamics and financial analysis. The prominent digital tickers, coupled with overlaid bar and line graphs, suggest a modern approach to tracking stock performances and investment strategies. Suitable for use in presentations, articles providing stock market reviews, educational materials on financial technology, or websites focusing on investment banking and stock market coverage.
Powered by 


2
downloads
downloads
Tags:
More
Credit Photo
If you would like to credit the Photo, here are some ways you can do so
Text Link
photo Link
<span class="text-link">
<span>
<a target="_blank" href=https://pikwizard.com/photo/dynamic-stock-market-analysis-with-digital-tickers-and-bar-graphs/beee3d004716b8911b52333fdd8d1b64/>PikWizard</a>
</span>
</span>
<span class="image-link">
<span
style="margin: 0 0 20px 0; display: inline-block; vertical-align: middle; width: 100%;"
>
<a
target="_blank"
href="https://pikwizard.com/photo/dynamic-stock-market-analysis-with-digital-tickers-and-bar-graphs/beee3d004716b8911b52333fdd8d1b64/"
style="text-decoration: none; font-size: 10px; margin: 0;"
>
<img src="https://pikwizard.com/pw/medium/beee3d004716b8911b52333fdd8d1b64.jpg" style="margin: 0; width: 100%;" alt="" />
<p style="font-size: 12px; margin: 0;">PikWizard</p>
</a>
</span>
</span>
Free (free of charge)
Free for personal and commercial use.
Author: Authentic Images
Similar Free Stock Images

Premium


Premium


Premium


Premium


Premium

Premium


Premium


Premium


Premium


Premium


Premium


Premium


Premium


Premium


Premium


Premium


Premium

Premium


Premium


Premium


Premium


Premium


Premium

Premium