
- Home >
- Stock Photos >
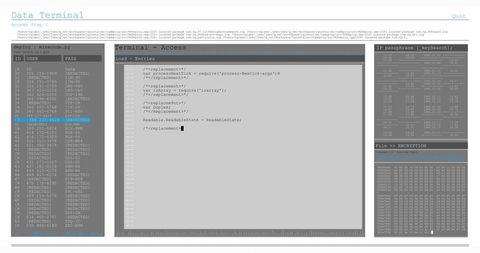
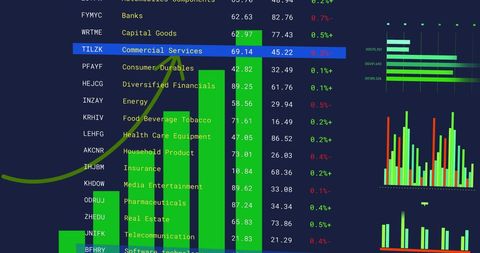
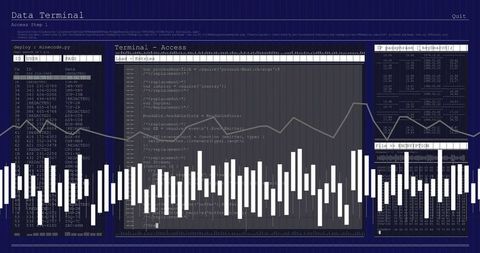
- Dynamic Stock Market Analysis with Multicolored Statistics
Dynamic Stock Market Analysis with Multicolored Statistics Image

This digital representation features multicolored graphs over a black background, illustrating various market sectors such as education real estate, food beverage, and media entertainment. Useful for presentations on investment, business growth, stock market analysis, and financial reporting. Ideal for use in technology-focused financial services and market forecasting tools.
Powered by  - Get 15% off with code: PIKWIZARD15


Credit Photo
If you would like to credit the Photo, here are some ways you can do so
Text Link
photo Link
<span class="text-link">
<span>
<a target="_blank" href=https://pikwizard.com/photo/dynamic-stock-market-analysis-with-multicolored-statistics/3b9bfcd10aa33d52e64b630930ba8f73/>PikWizard</a>
</span>
</span>
<span class="image-link">
<span
style="margin: 0 0 20px 0; display: inline-block; vertical-align: middle; width: 100%;"
>
<a
target="_blank"
href="https://pikwizard.com/photo/dynamic-stock-market-analysis-with-multicolored-statistics/3b9bfcd10aa33d52e64b630930ba8f73/"
style="text-decoration: none; font-size: 10px; margin: 0;"
>
<img src="https://pikwizard.com/pw/medium/3b9bfcd10aa33d52e64b630930ba8f73.jpg" style="margin: 0; width: 100%;" alt="" />
<p style="font-size: 12px; margin: 0;">PikWizard</p>
</a>
</span>
</span>
Free (free of charge)
Free for personal and commercial use.
Author: Authentic Images
Similar Free Stock Images
Loading...
Premium


Premium

Premium

Premium

Premium


Premium


Premium


Premium


Premium


Premium


Premium


Premium

Premium


Premium


Premium


Premium


Premium

Premium

Premium


Premium

Premium


Premium


Premium


Premium


Premium
