
- Home >
- Stock Photos >
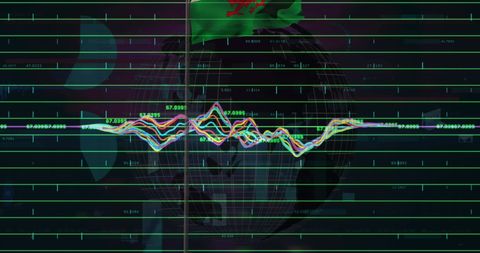
- Dynamic Stock Market Analysis with Trend Lines
Dynamic Stock Market Analysis with Trend Lines Image

Bright trend lines stand out against a dark grid, representing real-time market analysis useful for illustrating concepts in finance, trends in trading, and business decisions. Suitable for articles on financial forecasting, presentations on investment strategies, and websites focused on economic trends.
Powered by 


2
downloads
downloads
Tags:
More
Credit Photo
If you would like to credit the Photo, here are some ways you can do so
Text Link
photo Link
<span class="text-link">
<span>
<a target="_blank" href=https://pikwizard.com/photo/dynamic-stock-market-analysis-with-trend-lines/33ab22aabaffcd3e2eae4b05b53e03b2/>PikWizard</a>
</span>
</span>
<span class="image-link">
<span
style="margin: 0 0 20px 0; display: inline-block; vertical-align: middle; width: 100%;"
>
<a
target="_blank"
href="https://pikwizard.com/photo/dynamic-stock-market-analysis-with-trend-lines/33ab22aabaffcd3e2eae4b05b53e03b2/"
style="text-decoration: none; font-size: 10px; margin: 0;"
>
<img src="https://pikwizard.com/pw/medium/33ab22aabaffcd3e2eae4b05b53e03b2.jpg" style="margin: 0; width: 100%;" alt="" />
<p style="font-size: 12px; margin: 0;">PikWizard</p>
</a>
</span>
</span>
Free (free of charge)
Free for personal and commercial use.
Author: Authentic Images
Similar Free Stock Images

Premium


Premium


Premium


Premium


Premium


Premium


Premium


Premium


Premium


Premium


Premium


Premium


Premium


Premium


Premium


Premium


Premium


Premium


Premium


Premium


Premium


Premium


Premium


Premium


Premium

