
- Home >
- Stock Photos >
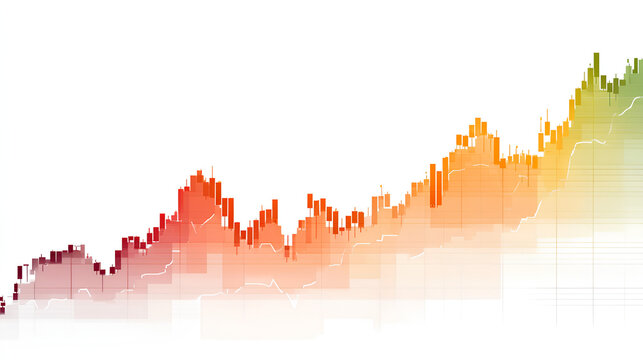
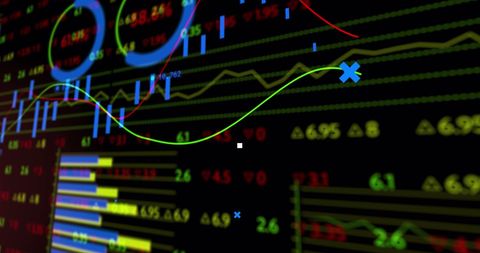
- Dynamic Stock Market Analytics with Data Visualization
Dynamic Stock Market Analytics with Data Visualization Image

Vibrant stock market analytics screen featuring various line and bar charts. Capture of fluctuating data signifies dynamic movements. Ideal for illustrating concepts related to finance, investment strategies, and data analysis for blogs, reports, and educational presentations.
Powered by 


downloads
Tags:
More
Credit Photo
If you would like to credit the Photo, here are some ways you can do so
Text Link
photo Link
<span class="text-link">
<span>
<a target="_blank" href=https://pikwizard.com/photo/dynamic-stock-market-analytics-with-data-visualization/472bdff35bff898b182396eeed06580c/>PikWizard</a>
</span>
</span>
<span class="image-link">
<span
style="margin: 0 0 20px 0; display: inline-block; vertical-align: middle; width: 100%;"
>
<a
target="_blank"
href="https://pikwizard.com/photo/dynamic-stock-market-analytics-with-data-visualization/472bdff35bff898b182396eeed06580c/"
style="text-decoration: none; font-size: 10px; margin: 0;"
>
<img src="https://pikwizard.com/pw/medium/472bdff35bff898b182396eeed06580c.jpg" style="margin: 0; width: 100%;" alt="" />
<p style="font-size: 12px; margin: 0;">PikWizard</p>
</a>
</span>
</span>
Free (free of charge)
Free for personal and commercial use.
Author: Authentic Images
Similar Free Stock Images

Premium


Premium


Premium


Premium


Premium


Premium


Premium

Premium

Premium

Premium


Premium


Premium


Premium


Premium

Premium


Premium


Premium


Premium


Premium


Premium


Premium


Premium


Premium


Premium


Premium

Explore More Free Stock Images