1. Home > 
  2. Stock Photos > 
  3. Dynamic Stock Market Chart and Data Graph Interface

Dynamic Stock Market Chart and Data Graph Interface Image

Dynamic Stock Market Chart and Data Graph Interface

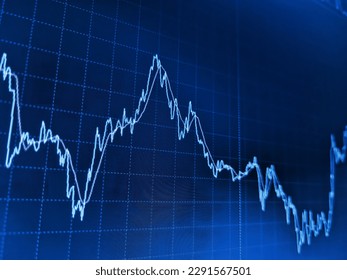
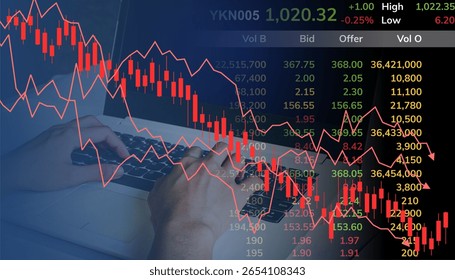
This digital illustration of a stock market interface shows a bustling candlestick chart and vibrant data graphs overlay. Perfect for presentations and marketing materials related to financial services, investment advice, and stock market analysis, showcasing the dynamic nature of technology in trading and finance.

Powered by Shutterstock logo - Get 15% off with code: PIKWIZARD15
stock market candlestick chart pattern design on blue background, business financial growth - Powered by Shutterstock - Get 15% off with code: PIKWIZARD15Showing chart with candlestick bars, line graph, labels on screen, hex grid overlay, diagonal bars. Technology, finance, analytics, data, dashboard, visualization, digital - Powered by Shutterstock - Get 15% off with code: PIKWIZARD15stock market candlestick chart pattern design on blue background, business financial growth - Powered by Shutterstock - Get 15% off with code: PIKWIZARD15Stock market analysis with candlestick chart and price movement trend line, highlighting global financial trends, stock trading, and investment strategy insights Latch - Powered by Shutterstock - Get 15% off with code: PIKWIZARD15Bullish green stock market chart with candlesticks - Powered by Shutterstock - Get 15% off with code: PIKWIZARD15

Credit Photo

If you would like to credit the Photo, here are some ways you can do so

Free (free of charge)

Free for personal and commercial use.

Author: Creative Art

Similar Free Stock Images

Dynamic Financial Data with Global Analytics Concepts
Premium
Glowing orange candlestick and line chart set against a dark grid background, symbolizing dynamic stock market trading, investment analytics, financial growth, trend forecasting, and technological mar
Dynamic Digital Financial Chart with Market Trends and Data Analysis
Premium
investment, graph, cryptocurrency, bitcoin, indicator, hand, investing, trader, risk, diagrams. hold smartphone via fingertips. then upper that's candlestick chart of investment cryptocurrency showing
Premium
Blue stock market chart with candlesticks and data
Paris Architecture Illuminated by Financial Market Trends Overlay
Global Financial Data Analysis and Technology Trends
Digital Stock Market Data and Financial Charts Interface
Global Business Interface with Digital Data Visualization Concepts
Premium
candlestick, bar, businessman, business, graph, chart, growth, finance, technology, financial. A man in a suit holding a hand up to a screen with a candlestick and lines.
Dynamic Stock Market Data on Digital Display
Futuristic Global Data Analytics with Blue World Map Overlay
Dynamic Digital Interface with Stock Market Tickers
Financial Data Trends on Stock Market Graph
Premium
Business, do this deal on a stock exchange. Stock market or forex trading graph and candlestick chart suitable for financial investment concept. Stock analyzing
Futuristic Financial Data Display with Stock Market Analysis
Financial Data Overlay on Office Desk with Visible Growth Chart
Futuristic Financial Dashboard Showing Layered Market Charts and Colored Trend Lines
Financial Trading Terminal with Dynamic Data Visualization
Premium
Stock market downturn with red candlestick chart, declining line graphs, and trading data screen. Ideal for illustrating financial loss, recession, risk, and economic decline in business visuals.
Premium
Bangkok night cityscape and forex stock market hologram, candlesticks dynamics and statistics, bar chart with numbers. Concept of money investment, trading and profit
Digital Stock Market Analysis with Financial Charts and Data Visualization
Digital Financial Data Graph with Winter Snowflake Theme
Financial Trading Chart Displaying Candlestick Pattern and Tickers
Rising Candlestick Chart on Dynamic Digital Financial Display
Financial Data Processing Overlaying Urban Streetscape
Premium
Stock market growth vector with green candlestick chart and rising lines. Ideal for illustrating profit, success, investment growth, financial gain, and bullish economic trends in business media.
Dynamic Financial Analytic Dashboard with Stock Candlestick Charts
Digital Financial Dashboard with Rising Candlestick Chart
Statistics and Data Processing with Graphs and Charts
3D Financial Chart with Candlestick Bars and Trend Lines
Digital Stock Market Data Visualization with Rising and Falling Prices
Futuristic Holographic Display of Financial Market Chart
Neon Financial Dashboard Displaying Market Charts and 38.67% Marker on Tilted Grid Monitor
Data Analytics with Stock Market Chart Display
Stock Market Analysis with 3D Digital Trading Dashboard Interface
Premium
Business concept: The magnifying glass focuses on the rising candlestick chart behind the search bar to provide data for financial analysis, market trend identification, and investment research.
Global Financial Data with Analytics Overlay Concept
Digital Trading Dashboard with Dynamic Candlestick Charts
Digital Trading Dashboard with Financial Data Visualization
Futuristic Financial Data Analysis with Global Market Insights
Premium
Stock Market Recession and Losses ,Businessman using finger pointing at trading price chart analysing trading downtrend line graph in bear market or market crash
FinTech Global Data Chart with Statistical Analysis
Financial Data Overlay with Business Growth Charts in Modern Cityscape
Global Stock Market Trading and Financial Analytics
Global Data Visualization with Candlestick Chart Overlay
DNA Strands on Stock Chart Digital Interface
Futuristic Digital Landscape with Data Visualization and Code
Financial Data Visualization on Dark Background for Analysis
Futuristic Financial Data Analysis with Global Technology Integration
Financial Data Processing with Abstract Digital Interface Graphics
Businesswoman Analyzing Financial Data on Laptop with Smartphone
Premium
Stock market analysis with candlestick chart and price movement trend line, highlighting global financial trends, stock trading, and investment strategy insights Vouch
Digital Data Processing and Stock Market Visualization
Abstract Financial Chart with Growing Cryptocurrency Trends
Premium
Displaying dashboard showing pie, bar, line and candlestick charts with percentage labels on screen. Futuristic, analytics, technology, innovation, data, interface, visualization
Abstract Financial Graph Overlay on Urban Map Grid Interface
Digital Stock Market Analysis with Falling Trend Arrow
Digital Interface with Stock Market and Cityscape Dynamics
Digital Financial Charts with Global Data Interface
Premium
Displaying golden sun rising above hills at dusk silhouetted trees overlaying financial data graphs. Scenic, natural, abstract, financial, data visualization, sunset, tranquil
Financial Graphs with Cityscape Background Reflecting Market Trends
Global Financial Analytics with Digital Interface and Earth Visualization
3D Financial Dashboard with Charts and Graphs for Analytical Insights
Premium
Displaying chart on grid showing bars and colored lines, percentage labels, candlesticks, red arrow. Data visualization, finance, analytics, technical, digital, modern, dashboard
Stock Market Graph and Data Analysis
Abstract Financial Data and Digital Analytics Visualization
Global Financial Markets and Technology Analysis
Digital Trading Interface with Candlestick and Line Graphs
Global Data Visualization with Digital World Map and Analytical Graphs
Digital Financial Data in Blue Theme Showing Analysis Concepts
Financial Growth Chart Data Analysis with Global Trends
Global Financial Data with Stylized Digital Interface
Dynamic Stock Market Chart with Shoe Icons Overlay
Digital Financial Data Display with Graphs and Statistics
Soundwaves with Graph Overlays in Data Processing Concept
Global Financial Data Visualization with Rotating Earth and Analytics
3D DNA Helix Intertwined with Financial Data Imagery
Premium
stock market candlestick chart pattern design on blue background, business financial growth
Global Financial Data and Statistics with Blue World Map Overlay
Premium
Stock chart displaying over rural fields at dawn, with lines candlestick bars percents gridlines. Financial analysis, data visualization, rural landscape, nature backdrop, sunrise, sunset, scenic
Global Stock Market Data Over Digital World Map
6G Technology Concept with Digital Graphs and Financial Charts
Global Market Analysis Candlestick Chart with Data Overlay
Abstract Digital Data Charts Illustrating Market Trends
Premium
Stock market analysis with candlestick chart and price movement trend line, highlighting global financial trends, stock trading, and investment strategy insights Marrow
Global Financial Data Analytics on Digital World Map Interface
Colombian Flag Merging with Stock Market Graphs Illustrating Economy
Dynamic Financial Charts and Data in Futuristic Interface
Global Economic Trends Overlapping Environmental Issues
Premium
Displaying wind turbines rotating over rural wind farm, showing candlestick chart overlay. Renewable, sustainability, technology, energy, grayscale, innovation, rural
Financial Trading Dashboard with Candlestick and Line Graphs
Global Financial Analysis with Candlestick Trends and Planet Earth
Abstract Financial Graphs with Digital Data Interfaces
Financial Market Chart with Candlestick Patterns and Trend Analysis
Futuristic Binary Sphere Over Trading Data Visual Interface
Financial Data Over Grid Indicating Market Trends and Analytics
Dynamic Stock Market Chart with Currency and Candlestick Graphs
Colombian Stock Market Data Amid Colored Background
Futuristic Virtual Stock Market Interface with Data Visualization
Premium
Financial chart overlay on NYC skyline with glowing bars and lines, futuristic graphic style, cityscape background, concept of trading and investment rise
Premium
Showing price labels and up or down triangle indicators on trading screen, with candlestick chart. Financial analysis, investment, market trends, digital dashboard, technical analysis, stock charts,
Rising Earnings Chart on Digital Trading Screen with Cryptocurrency Tickers
Global Data Transfer with Digital Analytics and Visualization
Candlestick Chart with Binary Code and Percent Indicators on Trading Screen
Premium
stock market candlestick chart pattern design on blue background, business financial growth
Premium
A hand holds a financial graph displaying upward market trends from 2021 to 2025 with candlestick patterns, on a dark background, symbolizing financial forecasting and future growth
Fluctuating Financial Stock Chart Display with Candlesticks
Digital Financial Data Analysis with Candlestick Graph and Trend Line
Digital Data Visualization with Futuristic Infographics
Premium
Businessman analyzing financial charts with falling graphs on a dark background, representing a stock market crisis concept
Digital Financial Data on World Map Illustrating Global Market Trends
Digital Soundwaves with Data Graphs and Coding Elements
Digital Financial Analysis with Graphs and Data Patterns
Dynamic Stock Market and Financial Data Analysis Concept
Digital Data Analytics Display with Global Business Interface
Financial Data Screens with Global Network Analysis
Global Data Analysis with Market Trends and Charts
Futuristic Data Analytics Interface with Programming Code
Premium
abstract Financial chart with moving up growing stock market graph in blue light color background
Abstract Financial Data Over Cityscape Imagery
Financial Data Visualization with Increasing Graph Trend
Financial Market Trends Over City Lights Digital Interface Concept
Futuristic Digital Trading Analytics for Financial Success
Premium
Monitoring smartphone, Indian analyst reviewing stock charts at office desk, with laptop monitor. Business, finance, technology, analytics, professional, modern, data
Explore More Free Stock Images