- Home >
- Stock Photos >
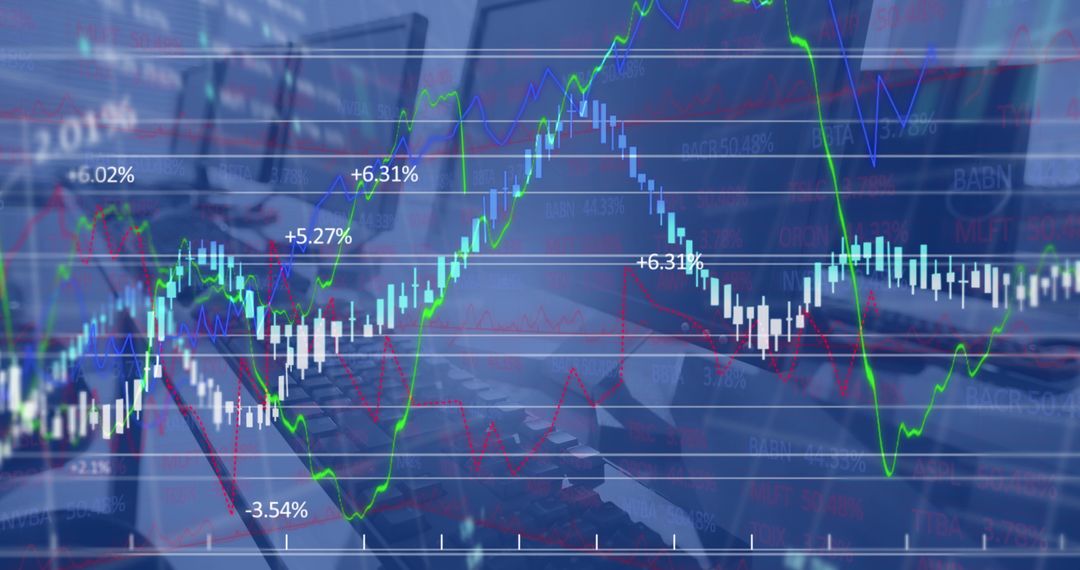
- Dynamic Stock Market Chart Displaying Fluctuating Trends and Growth Percentages
Dynamic Stock Market Chart Displaying Fluctuating Trends and Growth Percentages Image
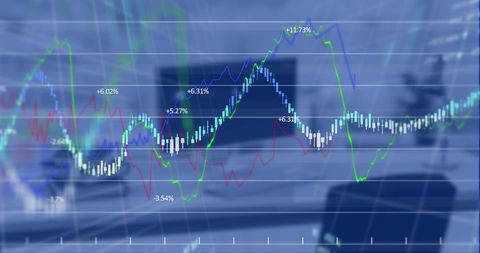
Depicts a dynamic stock market chart with various fluctuating lines and growth percentages. Representing financial analytics and investment trends, this can be used in articles or reports about economic analysis, business strategy, or market forecasting. Suitable for financial blogs, investor presentations, or educational content on market dynamics.
Powered by  - Get 15% off with code: PIKWIZARD15


2
downloads
downloads
Tags:
More
Credit Photo
If you would like to credit the Photo, here are some ways you can do so
Text Link
photo Link
<span class="text-link">
<span>
<a target="_blank" href=https://pikwizard.com/photo/dynamic-stock-market-chart-displaying-fluctuating-trends-and-growth-percentages/aa4b3e41e922db67153e9d8e3aa960ff/>PikWizard</a>
</span>
</span>
<span class="image-link">
<span
style="margin: 0 0 20px 0; display: inline-block; vertical-align: middle; width: 100%;"
>
<a
target="_blank"
href="https://pikwizard.com/photo/dynamic-stock-market-chart-displaying-fluctuating-trends-and-growth-percentages/aa4b3e41e922db67153e9d8e3aa960ff/"
style="text-decoration: none; font-size: 10px; margin: 0;"
>
<img src="https://pikwizard.com/pw/medium/aa4b3e41e922db67153e9d8e3aa960ff.jpg" style="margin: 0; width: 100%;" alt="" />
<p style="font-size: 12px; margin: 0;">PikWizard</p>
</a>
</span>
</span>
Free (free of charge)
Free for personal and commercial use.
Author: People Creations
Similar Free Stock Images

Premium


Premium


Premium


Premium


Premium


Premium


Premium


Premium


Premium


Premium


Premium


Premium


Premium


Premium


Premium


Premium


Premium


Premium


Premium


Premium


Premium


Premium


Premium


Premium