- Home >
- Stock Photos >
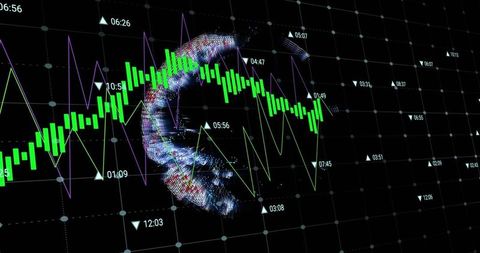
- Dynamic Stock Market Chart with Currency and Candlestick Graphs
Dynamic Stock Market Chart with Currency and Candlestick Graphs Image

Illustrating financial data interaction in a digital trader setting. Visual aids showing currency symbols and candlestick patterns ideal for presentations on investing, market analysis, financial forecasting, investment education, and economic trend presentations.
Powered by 


0
downloads
downloads
Tags:
More
Credit Photo
If you would like to credit the Photo, here are some ways you can do so
Text Link
photo Link
<span class="text-link">
<span>
<a target="_blank" href=https://pikwizard.com/photo/dynamic-stock-market-chart-with-currency-and-candlestick-graphs/2f7e1661a99b5396169055bf5da2f916/>PikWizard</a>
</span>
</span>
<span class="image-link">
<span
style="margin: 0 0 20px 0; display: inline-block; vertical-align: middle; width: 100%;"
>
<a
target="_blank"
href="https://pikwizard.com/photo/dynamic-stock-market-chart-with-currency-and-candlestick-graphs/2f7e1661a99b5396169055bf5da2f916/"
style="text-decoration: none; font-size: 10px; margin: 0;"
>
<img src="https://pikwizard.com/pw/medium/2f7e1661a99b5396169055bf5da2f916.jpg" style="margin: 0; width: 100%;" alt="" />
<p style="font-size: 12px; margin: 0;">PikWizard</p>
</a>
</span>
</span>
Free (free of charge)
Free for personal and commercial use.
Author: Authentic Images
Similar Free Stock Images
Loading...

Premium


Premium

Premium


Premium


Premium


Premium


Premium

Premium


Premium


Premium

Premium

Premium


Premium


Premium


Premium


Premium


Premium


Premium


Premium


Premium


Premium

Premium


Premium


Premium


Premium