
- Home >
- Stock Photos >
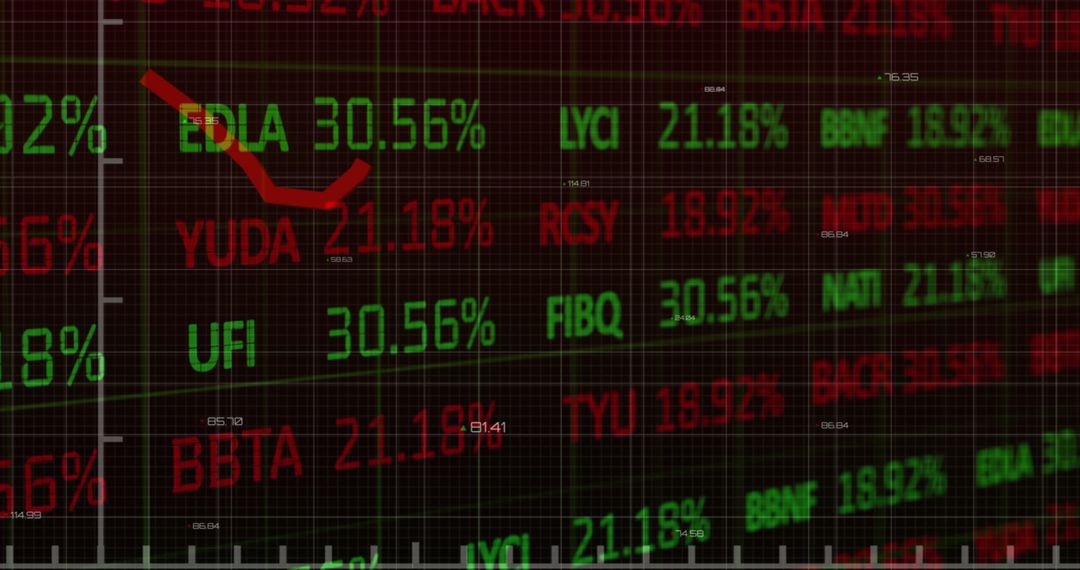
- Dynamic Stock Market Chart with Rising Trend Line
Dynamic Stock Market Chart with Rising Trend Line Image
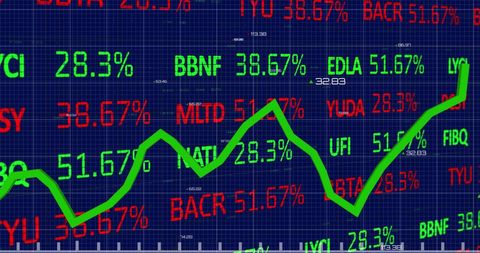
Visual representing stock market action in progress, featuring prominent percentages and dynamic trend lines, ideal for financial, economic analysis publications, investment blogs, or business presentations to depict active market conditions and showcase growth trends in an engaging visual format.
Powered by 


2
downloads
downloads
Tags:
More
Credit Photo
If you would like to credit the Photo, here are some ways you can do so
Text Link
photo Link
<span class="text-link">
<span>
<a target="_blank" href=https://pikwizard.com/photo/dynamic-stock-market-chart-with-rising-trend-line/dd3a7d50e22caf82caab7bb36c205aab/>PikWizard</a>
</span>
</span>
<span class="image-link">
<span
style="margin: 0 0 20px 0; display: inline-block; vertical-align: middle; width: 100%;"
>
<a
target="_blank"
href="https://pikwizard.com/photo/dynamic-stock-market-chart-with-rising-trend-line/dd3a7d50e22caf82caab7bb36c205aab/"
style="text-decoration: none; font-size: 10px; margin: 0;"
>
<img src="https://pikwizard.com/pw/medium/dd3a7d50e22caf82caab7bb36c205aab.jpg" style="margin: 0; width: 100%;" alt="" />
<p style="font-size: 12px; margin: 0;">PikWizard</p>
</a>
</span>
</span>
Free (free of charge)
Free for personal and commercial use.
Author: Authentic Images
Similar Free Stock Images

Premium


Premium


Premium


Premium


Premium


Premium


Premium


Premium


Premium


Premium


Premium


Premium


Premium


Premium


Premium


Premium


Premium


Premium


Premium


Premium


Premium


Premium


Premium


Premium

