- Home >
- Stock Photos >
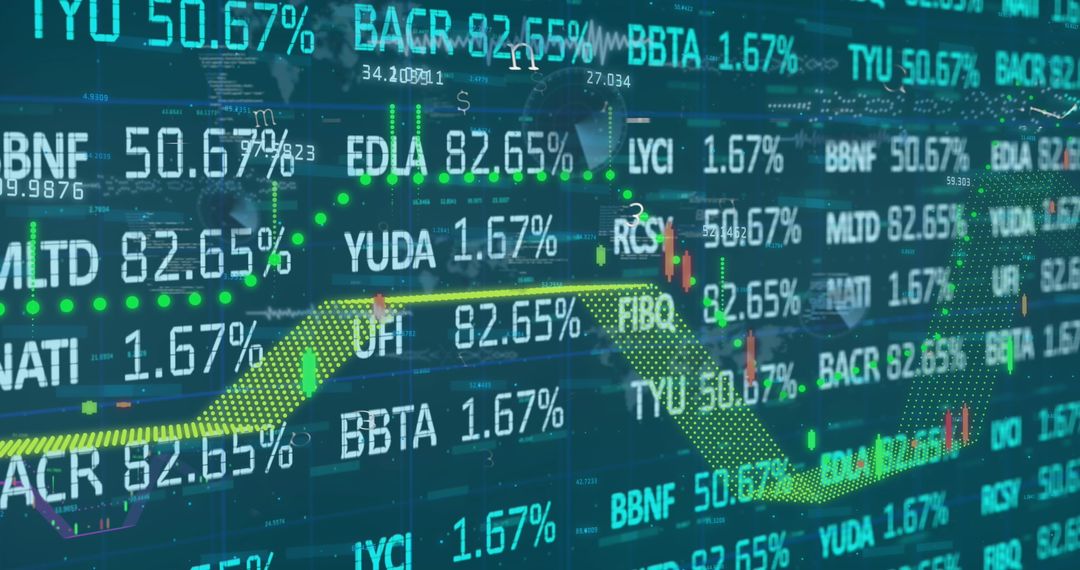
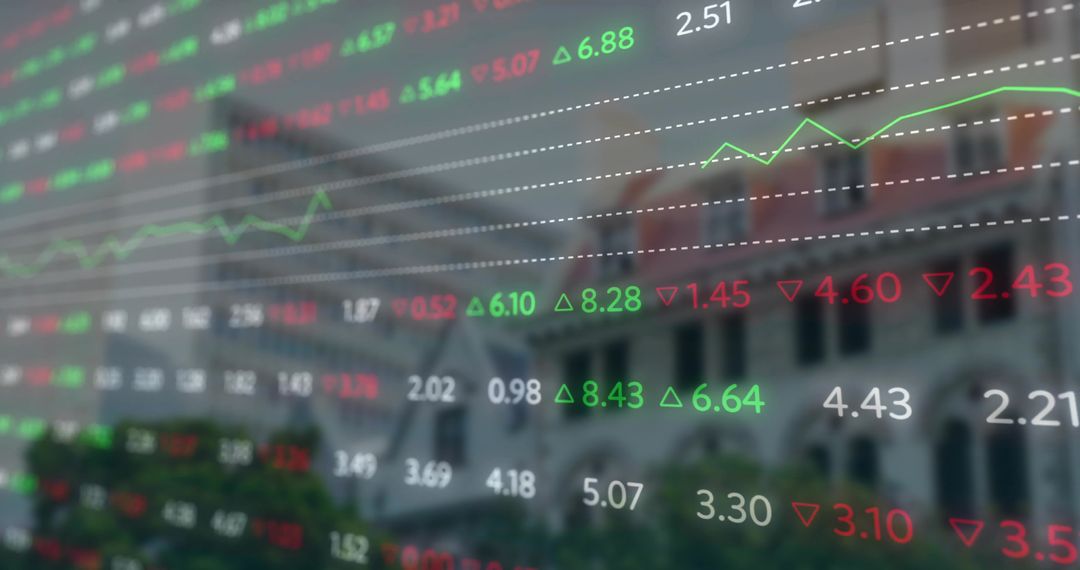
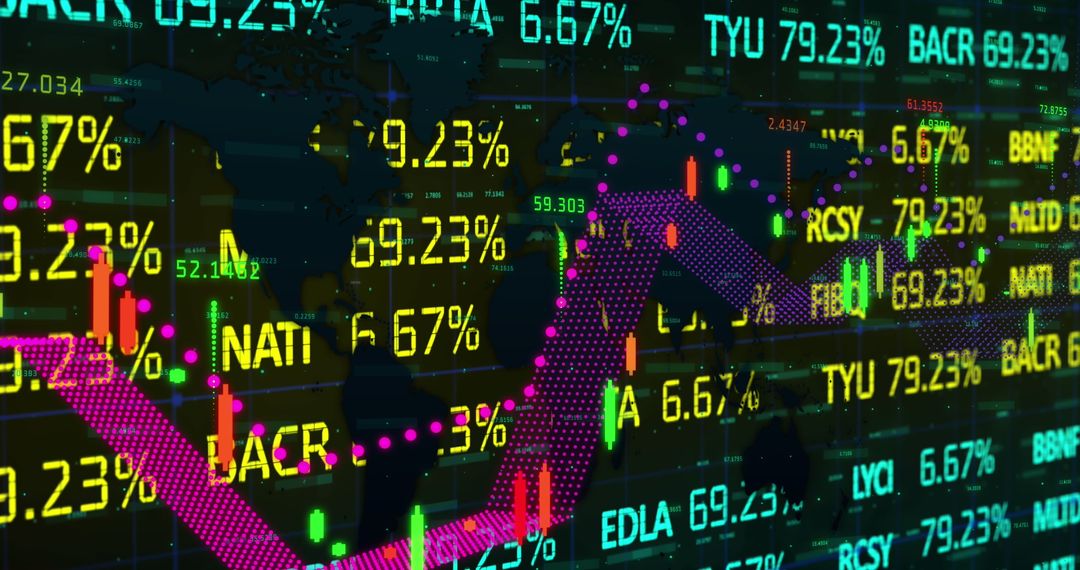
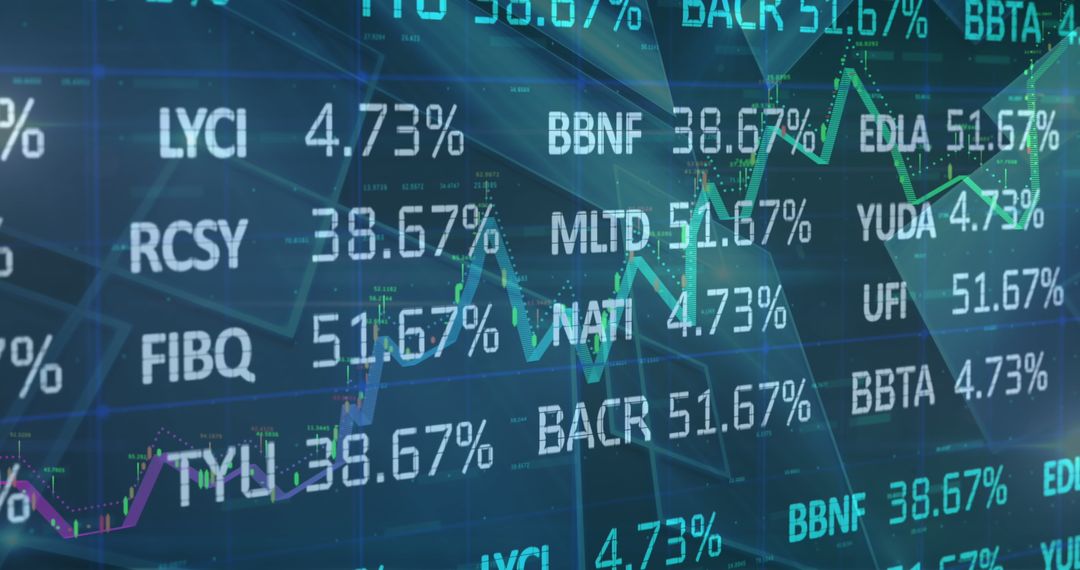
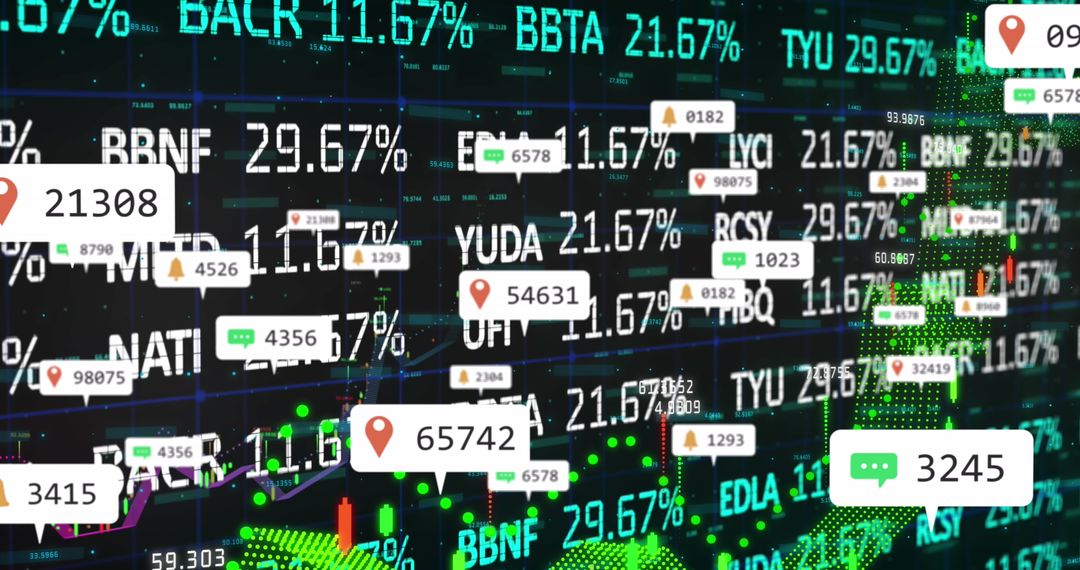
- Dynamic Stock Market Dashboard with Analytics Overlays
Dynamic Stock Market Dashboard with Analytics Overlays Image

Vibrant and dynamic, this scene depicts a colorful digital stock market dashboard layered with various financial data and ticker symbols. A 3D ribbon graph signifies economic trends while symbol overlays add an advanced analytic touch. Ideal for fintech promotional materials, investment consulting content, or finance-focused presentations to illustrate market dynamics and technological integration in financial analysis.
Powered by  - Get 15% off with code: PIKWIZARD15


2
downloads
downloads
Tags:
More
Credit Photo
If you would like to credit the Photo, here are some ways you can do so
Text Link
photo Link
<span class="text-link">
<span>
<a target="_blank" href=https://pikwizard.com/photo/dynamic-stock-market-dashboard-with-analytics-overlays/dd706a635926a2d040e4d953def77009/>PikWizard</a>
</span>
</span>
<span class="image-link">
<span
style="margin: 0 0 20px 0; display: inline-block; vertical-align: middle; width: 100%;"
>
<a
target="_blank"
href="https://pikwizard.com/photo/dynamic-stock-market-dashboard-with-analytics-overlays/dd706a635926a2d040e4d953def77009/"
style="text-decoration: none; font-size: 10px; margin: 0;"
>
<img src="https://pikwizard.com/pw/medium/dd706a635926a2d040e4d953def77009.jpg" style="margin: 0; width: 100%;" alt="" />
<p style="font-size: 12px; margin: 0;">PikWizard</p>
</a>
</span>
</span>
Free (free of charge)
Free for personal and commercial use.
Author: Creative Art
Similar Free Stock Images

Premium


Premium


Premium


Premium


Premium


Premium


Premium


Premium


Premium


Premium


Premium


Premium


Premium


Premium


Premium


Premium


Premium


Premium


Premium


Premium

Premium


Premium


Premium


Premium