- Home >
- Stock Photos >
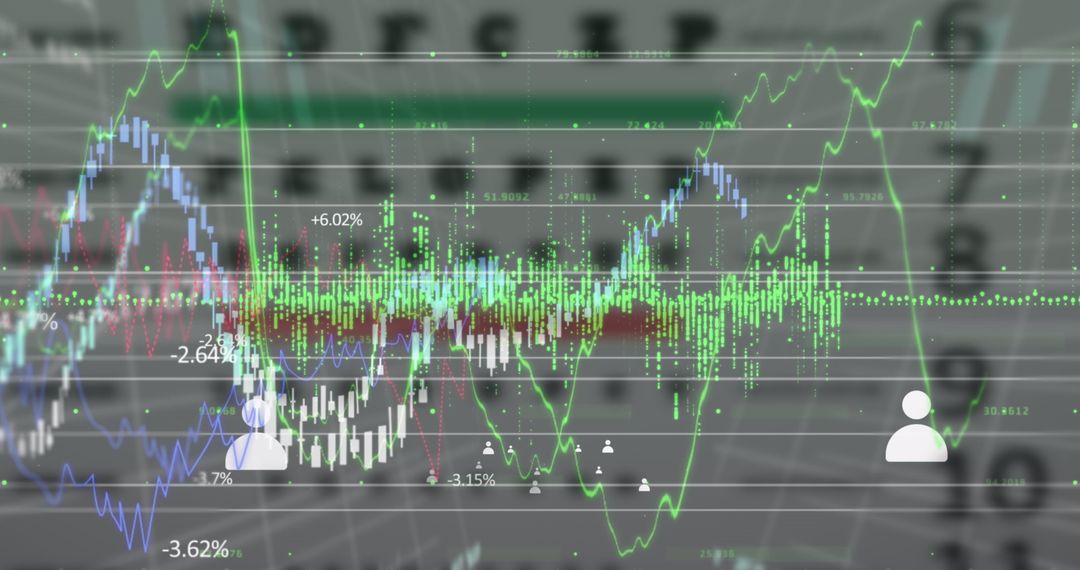
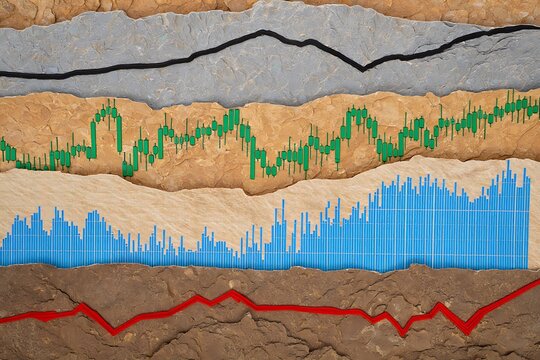
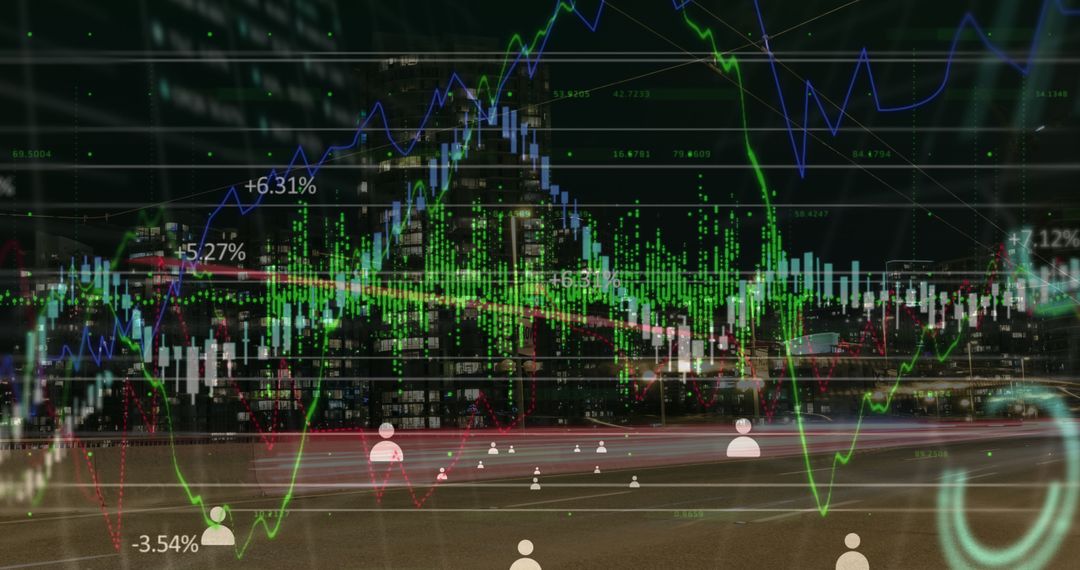
- Dynamic Stock Market Dashboard with Candlestick and Line Graphs
Dynamic Stock Market Dashboard with Candlestick and Line Graphs Image

This vibrant and complex visualization showcases a dynamic trading dashboard, featuring candlestick charts, line graphs, assorted financial data, tickers, and real-time analytics. Ideal for use on trading platforms, investment website banners, or educational materials focused on market analysis. Its rich detail offers insight into market trends and investment strategies.
Powered by 


0
downloads
downloads
Tags:
More
Credit Photo
If you would like to credit the Photo, here are some ways you can do so
Text Link
photo Link
<span class="text-link">
<span>
<a target="_blank" href=https://pikwizard.com/photo/dynamic-stock-market-dashboard-with-candlestick-and-line-graphs/ff3710a5e9352a64d92595986069910d/>PikWizard</a>
</span>
</span>
<span class="image-link">
<span
style="margin: 0 0 20px 0; display: inline-block; vertical-align: middle; width: 100%;"
>
<a
target="_blank"
href="https://pikwizard.com/photo/dynamic-stock-market-dashboard-with-candlestick-and-line-graphs/ff3710a5e9352a64d92595986069910d/"
style="text-decoration: none; font-size: 10px; margin: 0;"
>
<img src="https://pikwizard.com/pw/medium/ff3710a5e9352a64d92595986069910d.jpg" style="margin: 0; width: 100%;" alt="" />
<p style="font-size: 12px; margin: 0;">PikWizard</p>
</a>
</span>
</span>
Free (free of charge)
Free for personal and commercial use.
Author: People Creations
Similar Free Stock Images

Premium


Premium


Premium


Premium


Premium


Premium


Premium


Premium


Premium


Premium


Premium


Premium


Premium


Premium


Premium


Premium


Premium


Premium


Premium


Premium


Premium


Premium


Premium


Premium