- Home >
- Stock Photos >
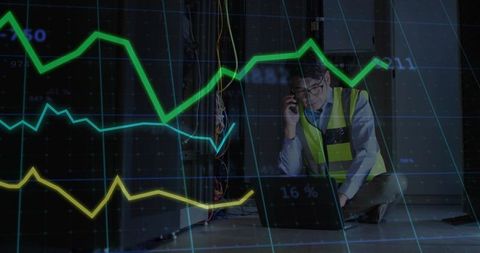
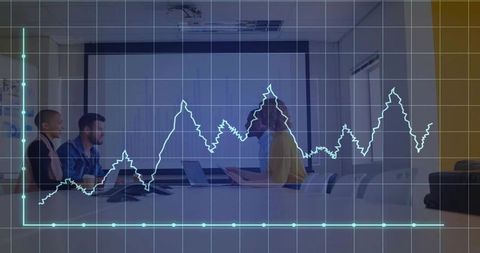
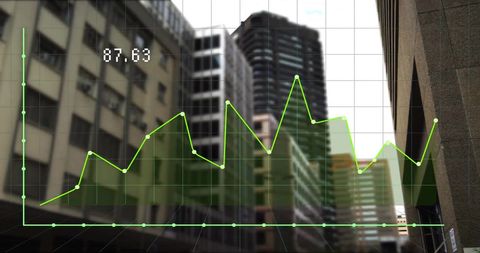
- Dynamic Stock Market Data Amid Empty Office Setting
Dynamic Stock Market Data Amid Empty Office Setting Image

Colorful financial data charts in office environment suggest dynamic market analysis amid tranquility. Suitable for conveying concepts like economic forecasting, investment strategies, or illustrating business analytics tools in advertisements, articles, and educational content.
Powered by  - Get 15% off with code: PIKWIZARD15


3
downloads
downloads
Tags:
More
Credit Photo
If you would like to credit the Photo, here are some ways you can do so
Text Link
photo Link
<span class="text-link">
<span>
<a target="_blank" href=https://pikwizard.com/photo/dynamic-stock-market-data-amid-empty-office-setting/aab58960166ed020cf5283910a6d8374/>PikWizard</a>
</span>
</span>
<span class="image-link">
<span
style="margin: 0 0 20px 0; display: inline-block; vertical-align: middle; width: 100%;"
>
<a
target="_blank"
href="https://pikwizard.com/photo/dynamic-stock-market-data-amid-empty-office-setting/aab58960166ed020cf5283910a6d8374/"
style="text-decoration: none; font-size: 10px; margin: 0;"
>
<img src="https://pikwizard.com/pw/medium/aab58960166ed020cf5283910a6d8374.jpg" style="margin: 0; width: 100%;" alt="" />
<p style="font-size: 12px; margin: 0;">PikWizard</p>
</a>
</span>
</span>
Free (free of charge)
Free for personal and commercial use.
Author: Authentic Images
Similar Free Stock Images
Loading...

Premium


Premium

Premium


Premium


Premium

Premium


Premium


Premium

Premium

Premium

Premium


Premium


Premium

Premium


Premium


Premium


Premium


Premium


Premium


Premium


Premium


Premium


Premium


Premium

Premium